Fig. 6
Download original image
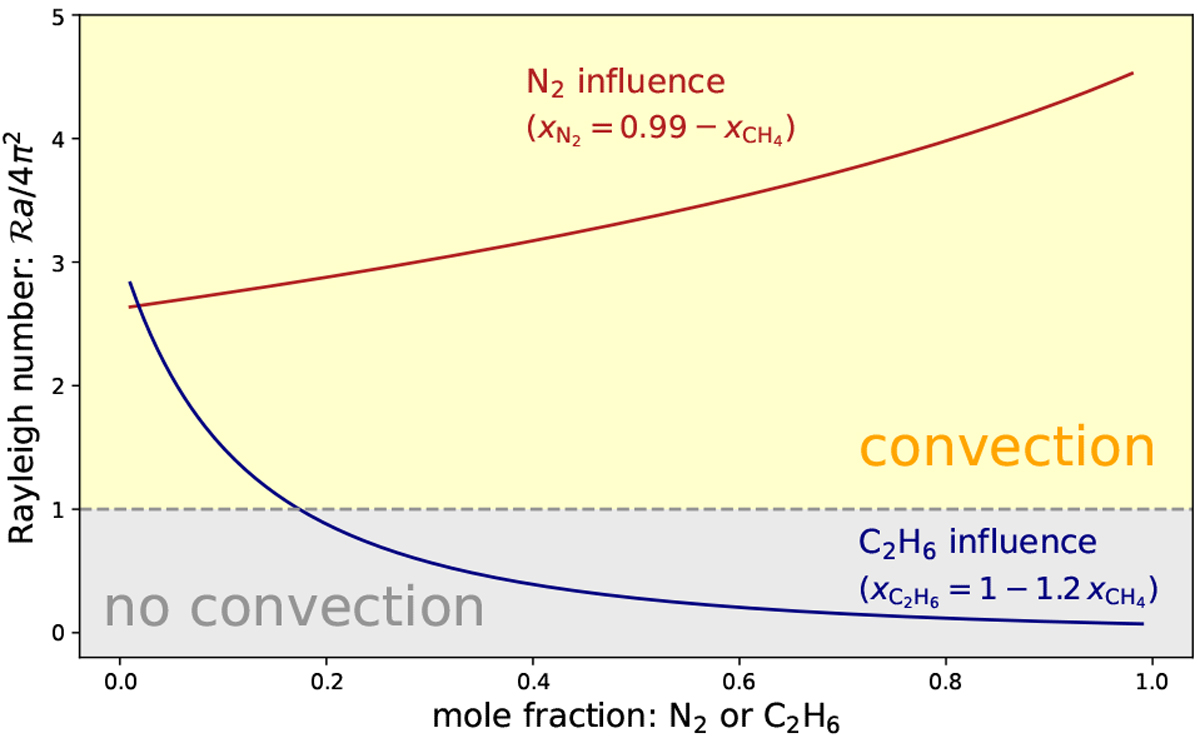
Influence of the chemical composition of the fluid on its Rayleigh number. These computations were made with a fixed permeability Kp, m = 10−12 m2, P = 20 bar, T = 90 K, H = 1 km, and a thermal gradient of 0.6 K km−1. The influence of ethane content (blue curve) has been explored by forcing the mole fraction of nitrogen to follow that of methane: ![]() . The role of nitrogen abundance (red curve) has been studied by keeping ethane mole fraction constant:
. The role of nitrogen abundance (red curve) has been studied by keeping ethane mole fraction constant:
![]() .
.
Current usage metrics show cumulative count of Article Views (full-text article views including HTML views, PDF and ePub downloads, according to the available data) and Abstracts Views on Vision4Press platform.
Data correspond to usage on the plateform after 2015. The current usage metrics is available 48-96 hours after online publication and is updated daily on week days.
Initial download of the metrics may take a while.