Fig. 3
Download original image
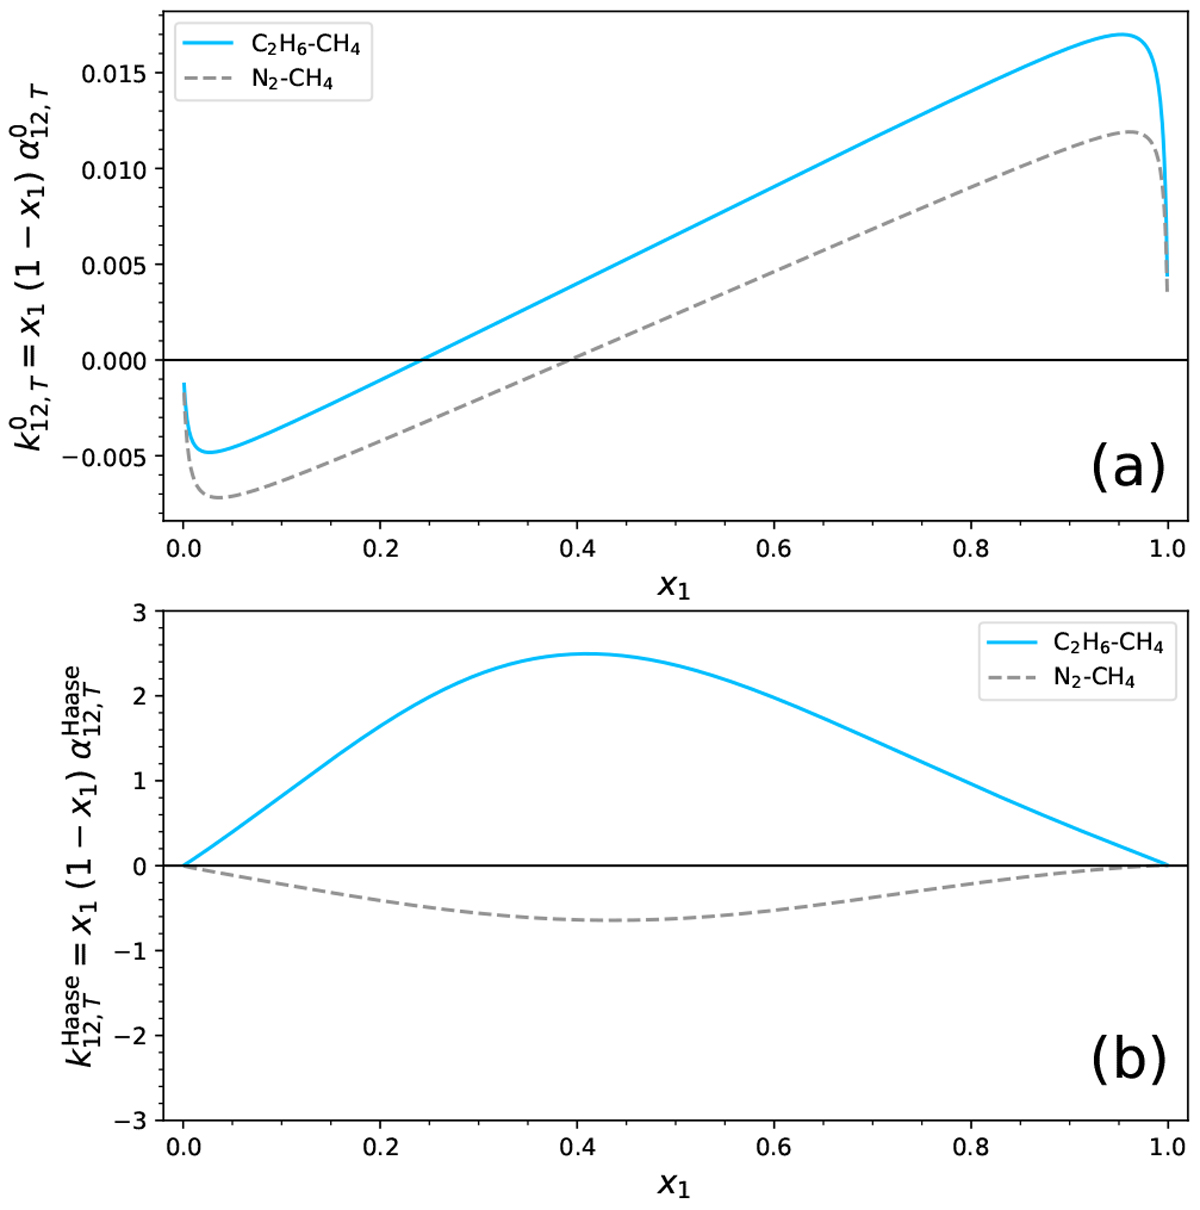
(a) Variation of ![]() as a functionof the mole fraction x1 of the first compound. The quantity
as a functionof the mole fraction x1 of the first compound. The quantity ![]() is chosen, because it represents the sensitivity of the system to a gradient of temperature. In this panel, all quantities are related to the ideal gas state (marked by the “0” superscript). (b) Similar plot using the thermal diffusion coefficient provided by Haase’s theory (see Eq. (B.19)). In both panels, the solid line is associated with the C2 H6-CH4 system, while the dashed line is related to N2-CH4. All computations represented in this figure assume a pressure of 1.5 bar and a temperature of 90 K.
is chosen, because it represents the sensitivity of the system to a gradient of temperature. In this panel, all quantities are related to the ideal gas state (marked by the “0” superscript). (b) Similar plot using the thermal diffusion coefficient provided by Haase’s theory (see Eq. (B.19)). In both panels, the solid line is associated with the C2 H6-CH4 system, while the dashed line is related to N2-CH4. All computations represented in this figure assume a pressure of 1.5 bar and a temperature of 90 K.
Current usage metrics show cumulative count of Article Views (full-text article views including HTML views, PDF and ePub downloads, according to the available data) and Abstracts Views on Vision4Press platform.
Data correspond to usage on the plateform after 2015. The current usage metrics is available 48-96 hours after online publication and is updated daily on week days.
Initial download of the metrics may take a while.