Fig. 8
Download original image
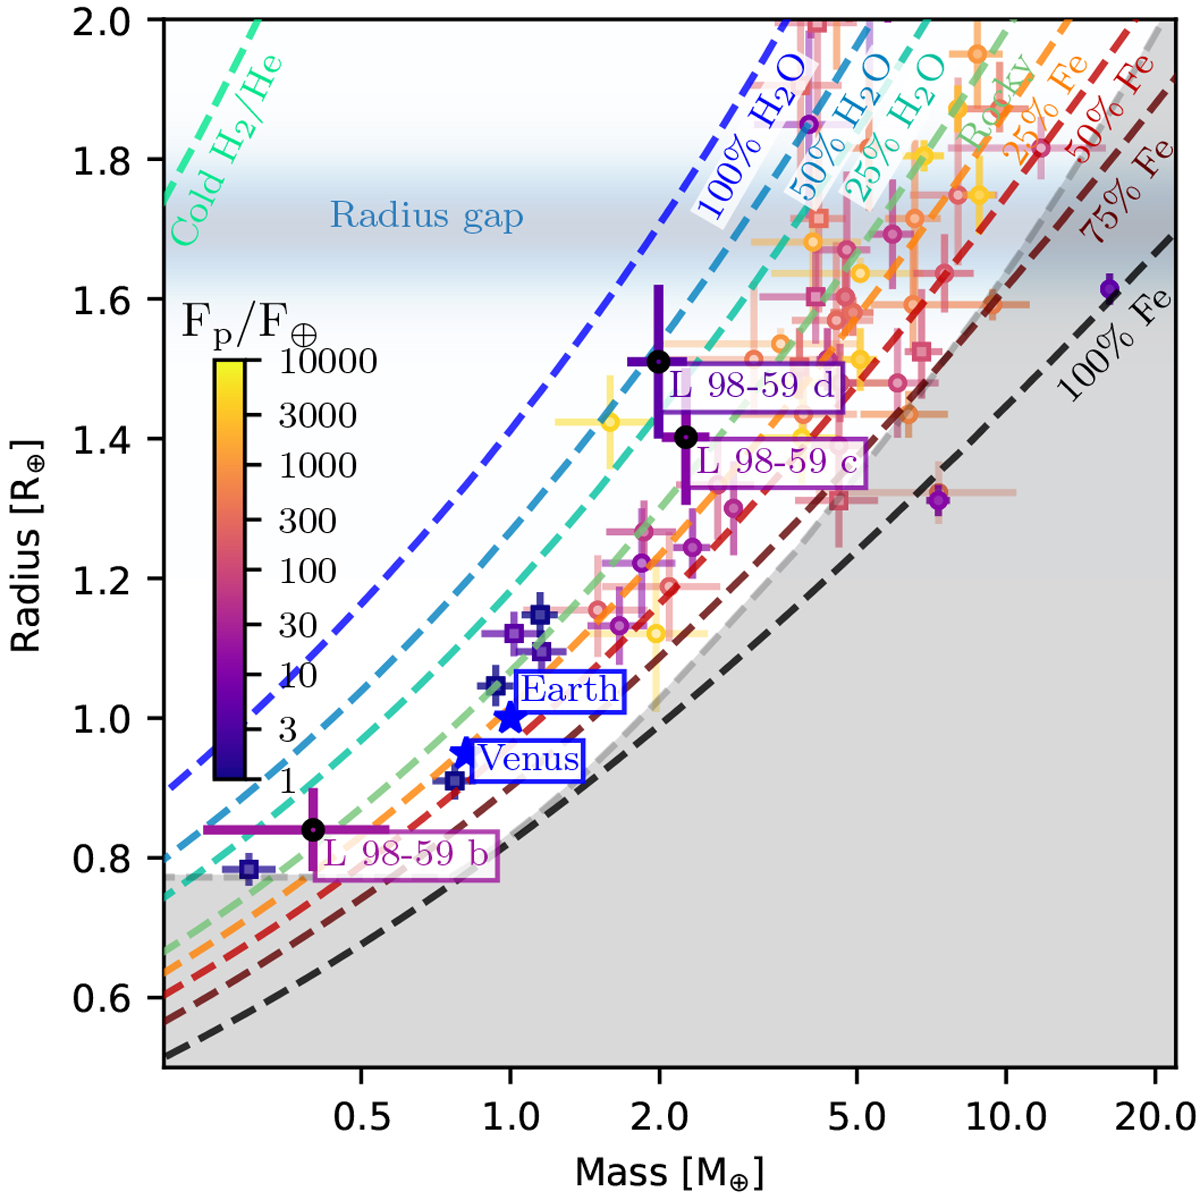
Mass-radius diagram of the small-planet population. Each point represents a confirmed exoplanet for which the mass and radius are measured with a relative precision better than 50%. These data have been extracted from exoplanet.eu (Schneider et al. 2011). The shape of the points indicates the technique used to measure the mass of the planet: circles for RV, and squares for transit timing variations. The color of the point reflects the intensity of the incident flux. The level of transparency of the error bars indicates the relative precision of the planetary bulk density. The better the precision, the more opaque the error bars. The three transiting planets in the L 98-59 system are labeled and appear circled in black. The labeled blue stars indicate the Solar System planets. The colored dashed lines are the mass-radius models from Zeng et al. (2016). The gray region indicates the maximum collision stripping of the mantle. The shaded horizontal blue line represent the radius gap (Fulton et al. 2017). L 98-59 b is in a sparsely populated region of the parameter space and currently the lowest-mass planet with a mass measured through RV. Lower planetary masses have all been measured through transit-timing variation, e.g., for Trappist-1 h (Gillon et al. 2017) to the left of L 98-59 b. This plot has been produced using the code available at https://github.com/odemangeon/mass-radius_diagram.
Current usage metrics show cumulative count of Article Views (full-text article views including HTML views, PDF and ePub downloads, according to the available data) and Abstracts Views on Vision4Press platform.
Data correspond to usage on the plateform after 2015. The current usage metrics is available 48-96 hours after online publication and is updated daily on week days.
Initial download of the metrics may take a while.