Fig. 7
Download original image
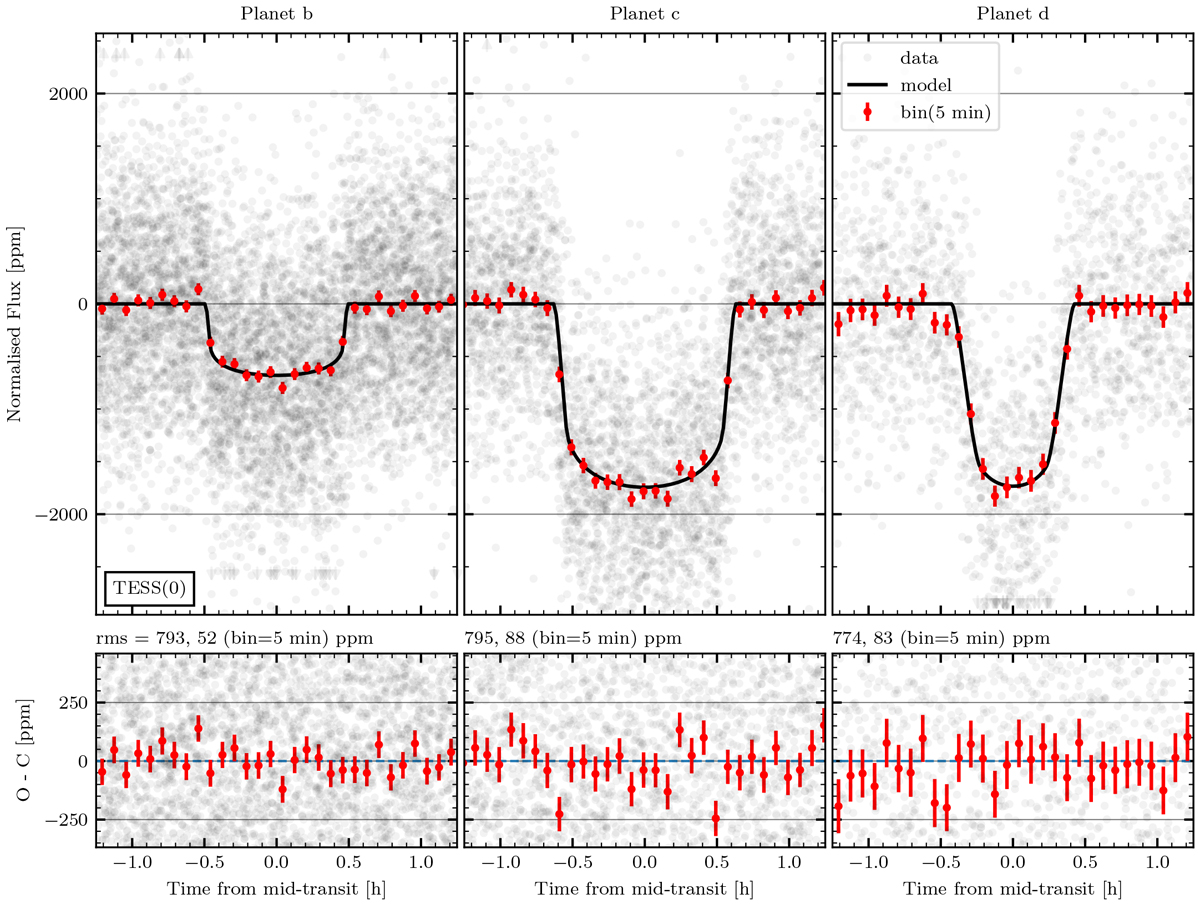
Phase-folded TESS LC, best model (top) and residuals (bottom) for the three transiting planets. The data presented in Sect. 2.2 are displayed in black. For clarity, the error bars are not displayed. The points with error bars in red correspond to averages of the data within evenly spaced bins in orbital phase whose size corresponds to 5 min. The best model is shown with a black line. The standard deviation of the raw and binned residuals is indicated above each residual plot.
Current usage metrics show cumulative count of Article Views (full-text article views including HTML views, PDF and ePub downloads, according to the available data) and Abstracts Views on Vision4Press platform.
Data correspond to usage on the plateform after 2015. The current usage metrics is available 48-96 hours after online publication and is updated daily on week days.
Initial download of the metrics may take a while.