Fig. 6
Download original image
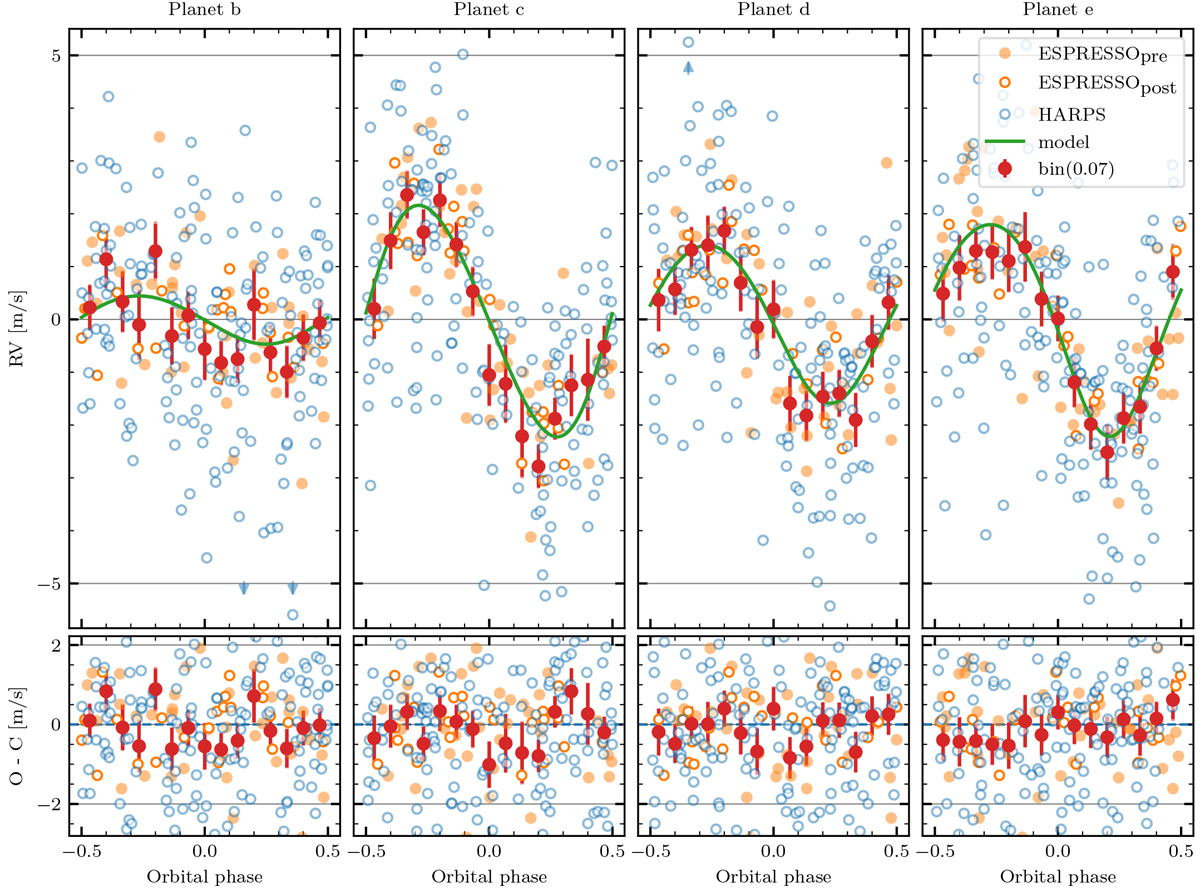
Phase-folded HARPS and ESPRESSO RV s, best model (top) and residuals (bottom) for the four planets. The HARPS data, presented in Sect. 2.1.1, are displayed with empty blue circles, and the ESPRESSO data, presented in Sect. 2.1.2, are displayed with orange circles. The filled orange circles are for the data taken before the fiber change of ESPRESSO. The empty orange circles are for data taken after the change. For clarity, the error bars of the HARPS and ESPRESSO data points are not displayed. For this plot, the stellar activity model has been subtracted from each data point. The points with error bars in red correspond to averages of the data within evenly spaced bins in orbital phase, whose size is 0.07 orbital period. The best model is shown with a green line. Before the subtraction of the stellar activity model the RMS of the RV data is 3.5, 3.4, and 3.2 m s−1 for HARPS, ESPRESSOpre, and ESPRESSOpost, respectively. After the subtraction of the stellar activity model, it is 2.9, 2.5, and 2.3 m s−1 for HARPS, ESPRESSOpre, and ESPRESSOpost, respectively. Finally, after subtraction of the planetary model, the RMS of the residuals is 1.8, 1.2, and 0.7 m s−1 for HARPS, ESPRESSOpre, and ESPRESSOpost, respectively.
Current usage metrics show cumulative count of Article Views (full-text article views including HTML views, PDF and ePub downloads, according to the available data) and Abstracts Views on Vision4Press platform.
Data correspond to usage on the plateform after 2015. The current usage metrics is available 48-96 hours after online publication and is updated daily on week days.
Initial download of the metrics may take a while.