Fig. F.2
Download original image
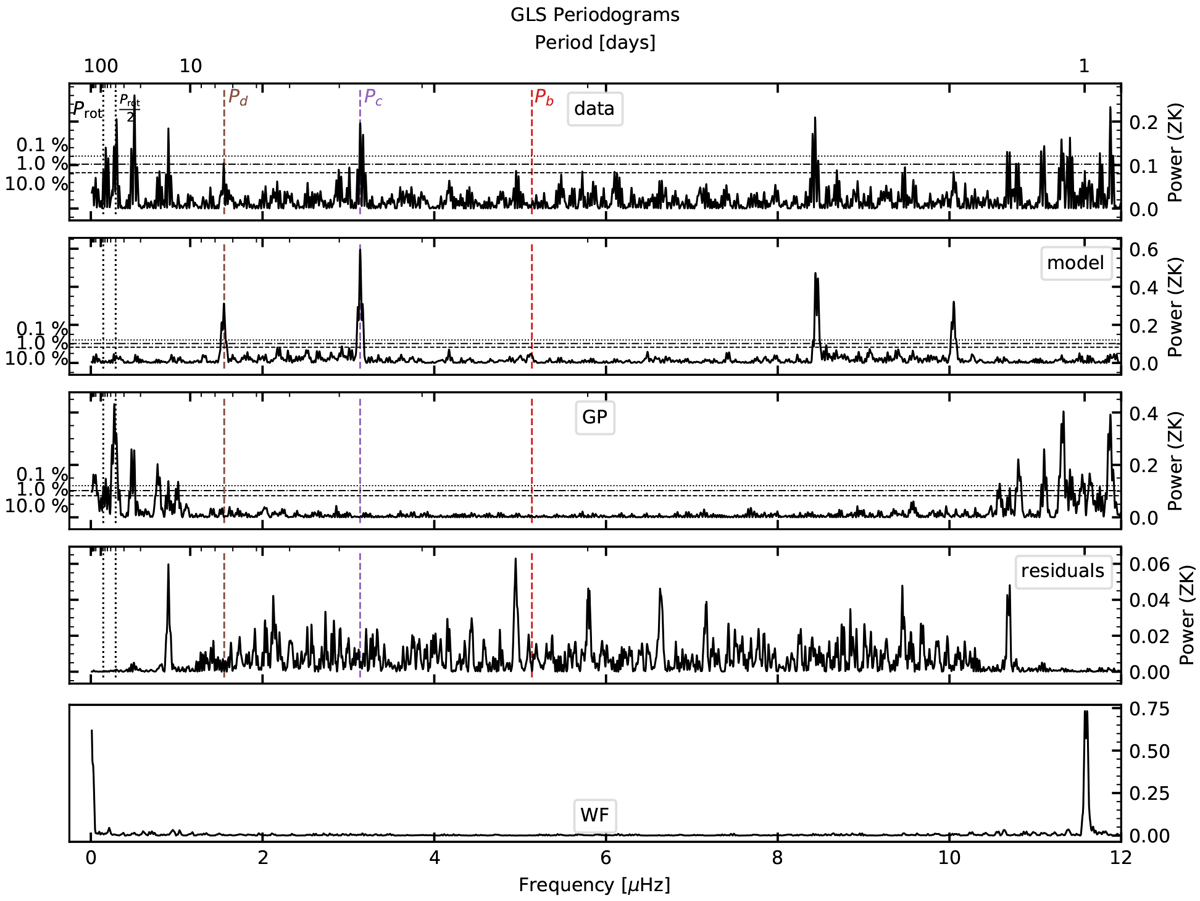
Outcome of the fit of the three-planet model: The format of this figure is identical to that in Fig. 5, but is described again here for convenience. GLSP s of the RV time series (top) and of the planetary (second) and stellar activity (third) models sampled at the same times as the RV data. GLSP of the time series of the residuals (fourth) and the window function (bottom). The vertical lines on the GLSP s correspond to the orbital periods of planets b, c, and d, half and thefull rotation period (estimated at 80 days) from right to left.
Current usage metrics show cumulative count of Article Views (full-text article views including HTML views, PDF and ePub downloads, according to the available data) and Abstracts Views on Vision4Press platform.
Data correspond to usage on the plateform after 2015. The current usage metrics is available 48-96 hours after online publication and is updated daily on week days.
Initial download of the metrics may take a while.