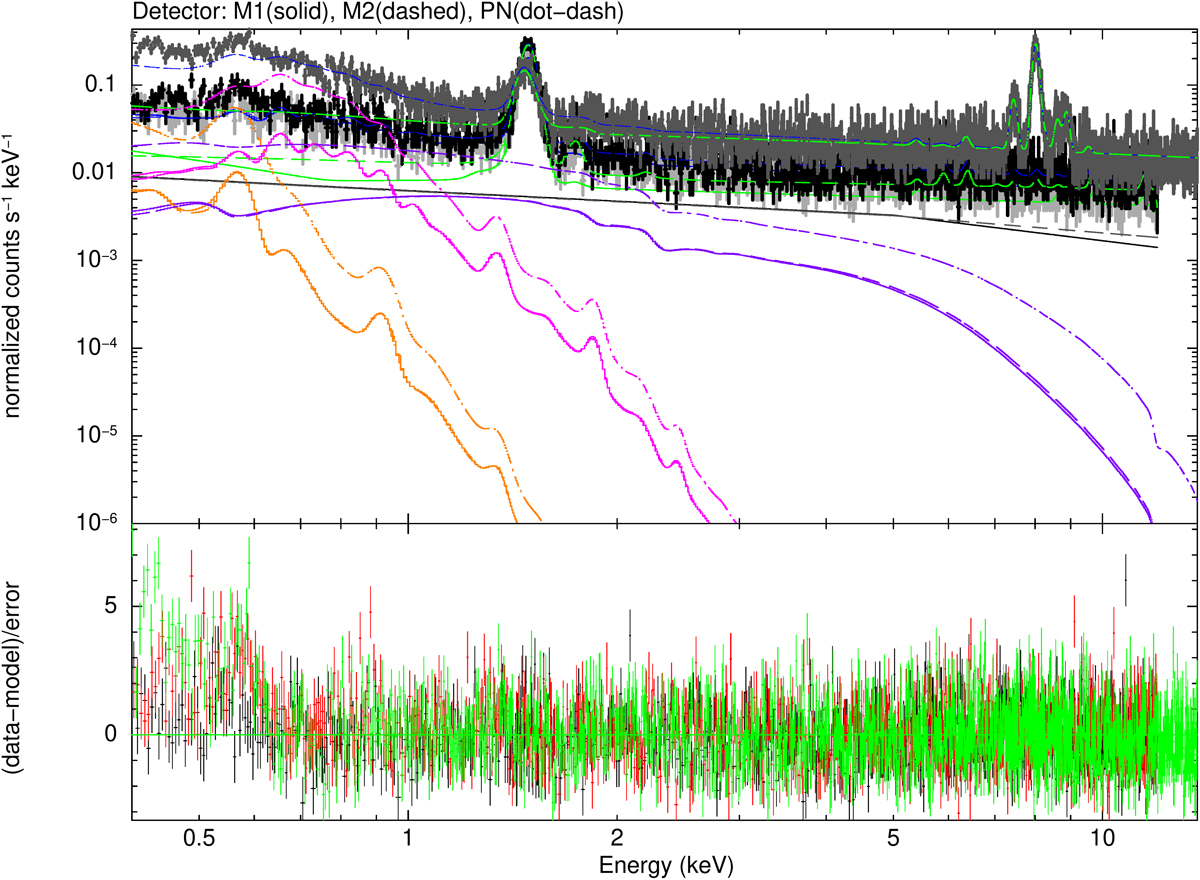
Fig. A.1.
Download original image
Energy spectrum of the CXB region with the best-fit model of all XMM-Newton detectors of the deep observation. The data points of EMOS1, EMOS2, and EPN are light gray, black, and dark gray in the upper panel, and black, red, and green in the lower panel, respectively. The model curves of EMOS1, EMOS2, and EPN are solid, dashed, and dot-dashed, respectively (mostly overlapping for the EMOS detectors). For each detector, the total model is shown as a blue curve, and the models of the CXB components, namely the local hot bubble, the Galactic halo, and the extragalactic emission are shown as orange, magenta, and violet curves, respectively. The [HEB,IBKG] and SPB models are shown as green and black curves, respectively (Sect. 3.2).
Current usage metrics show cumulative count of Article Views (full-text article views including HTML views, PDF and ePub downloads, according to the available data) and Abstracts Views on Vision4Press platform.
Data correspond to usage on the plateform after 2015. The current usage metrics is available 48-96 hours after online publication and is updated daily on week days.
Initial download of the metrics may take a while.