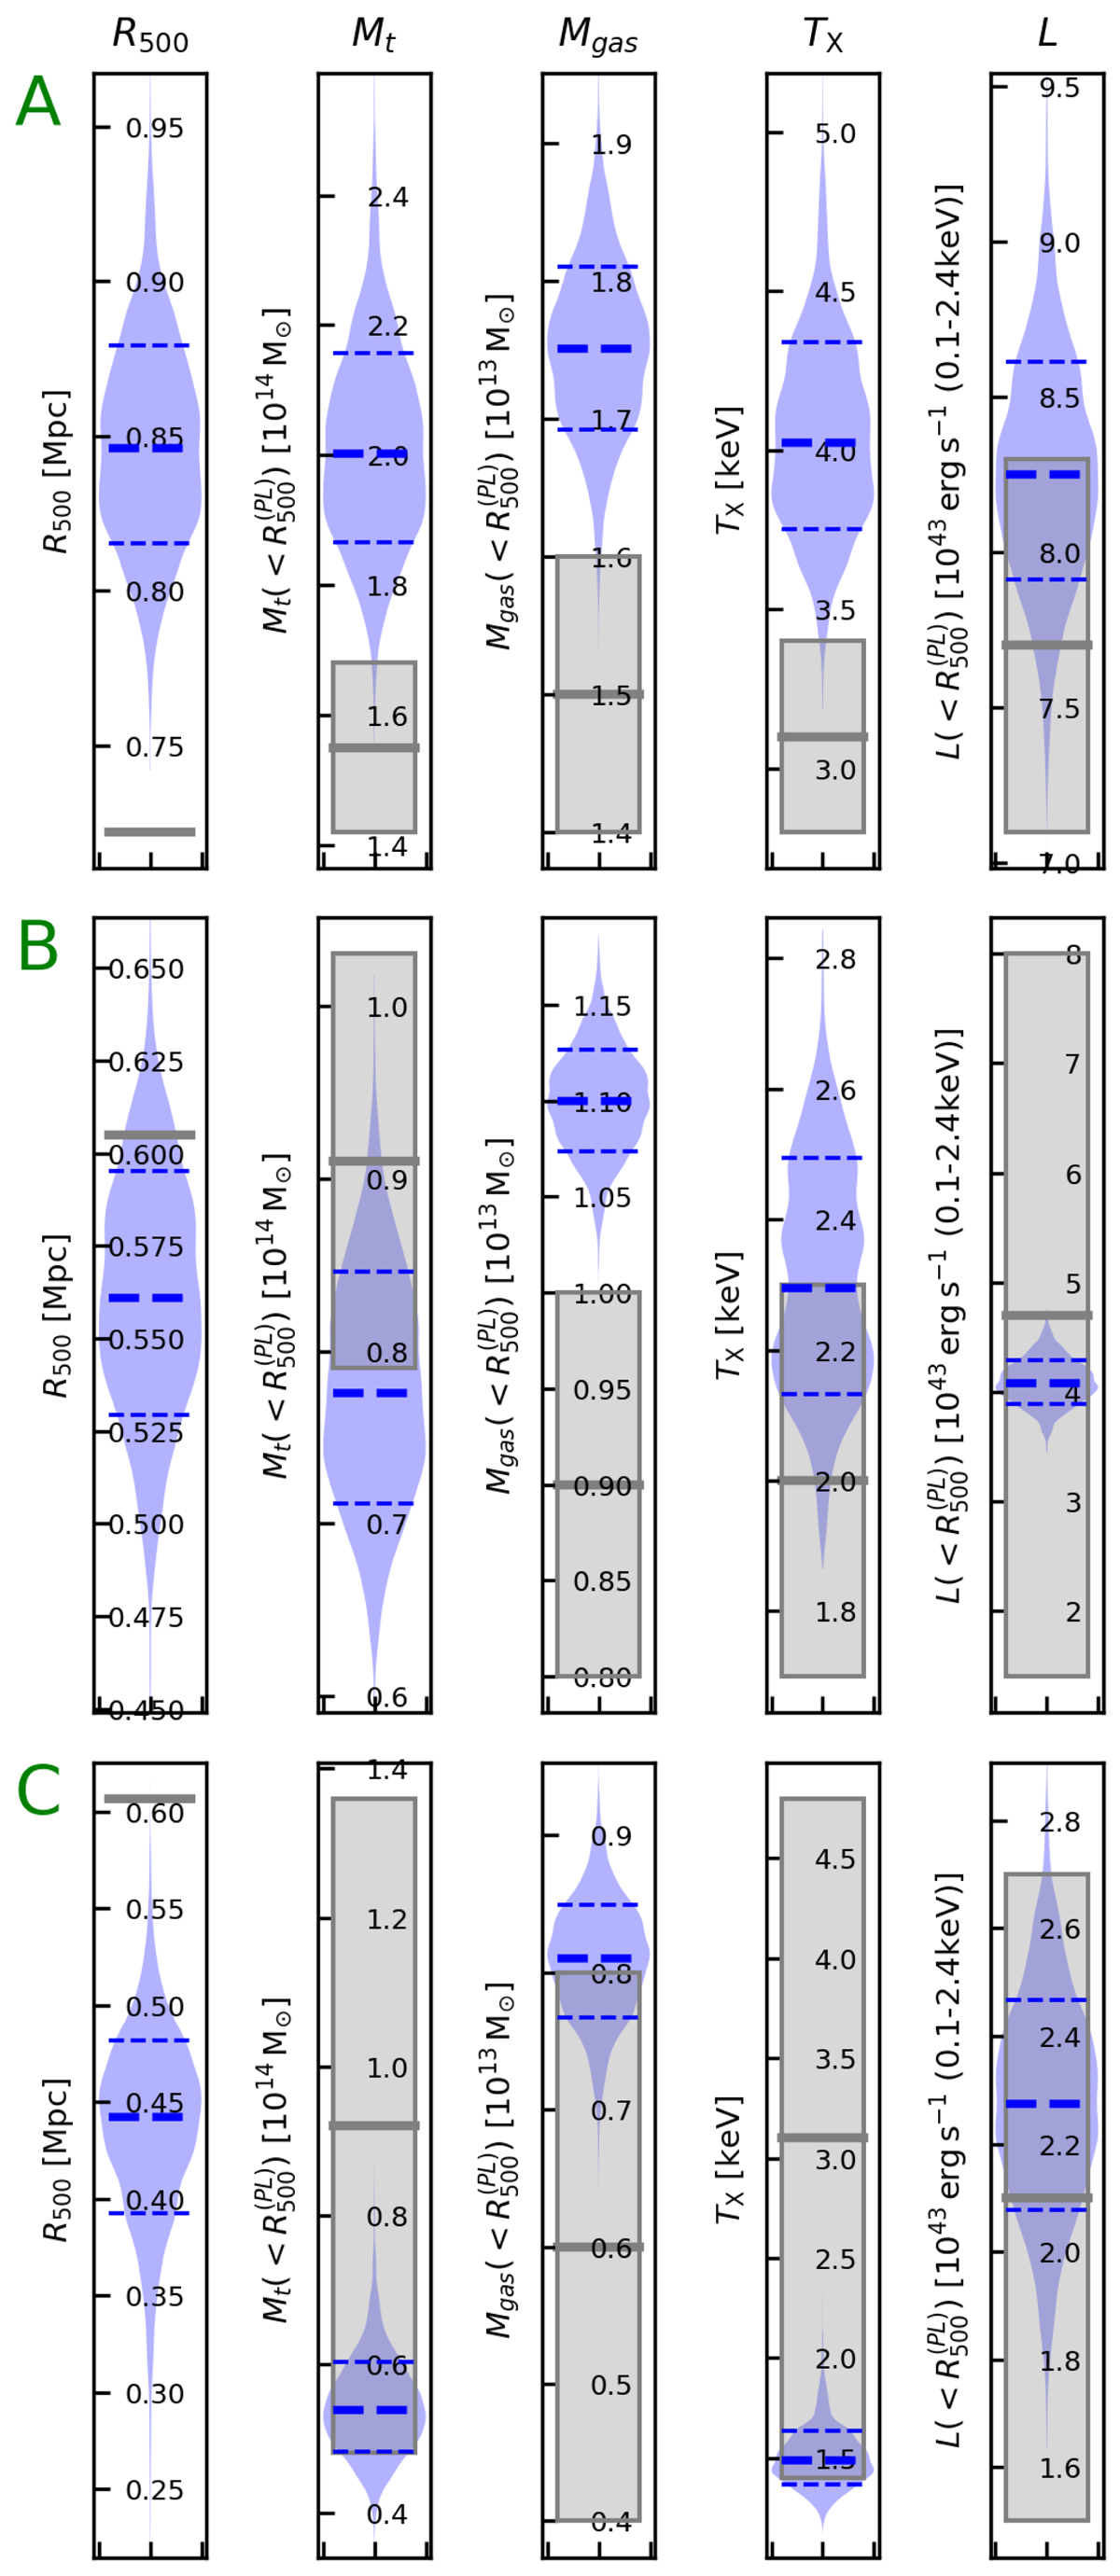
Fig. 8.
Download original image
Comparison of cluster parameters derived from our best fit of the isothermal beta-profile model in blue and estimated by PLIX2011 (Table 2) in gray. As the results for the polytropic NFW-profile model are almost the same, they are omitted for clarity. The blue thick and thin dash lines are the median and 1σ levels of our model. The gray areas show the 1σ levels of PLIX2011, except for R500, which was not provided. Top, middle, and bottom rows: clusters A, B, and C, respectively. See Sect. 3.4.1 for more details.
Current usage metrics show cumulative count of Article Views (full-text article views including HTML views, PDF and ePub downloads, according to the available data) and Abstracts Views on Vision4Press platform.
Data correspond to usage on the plateform after 2015. The current usage metrics is available 48-96 hours after online publication and is updated daily on week days.
Initial download of the metrics may take a while.