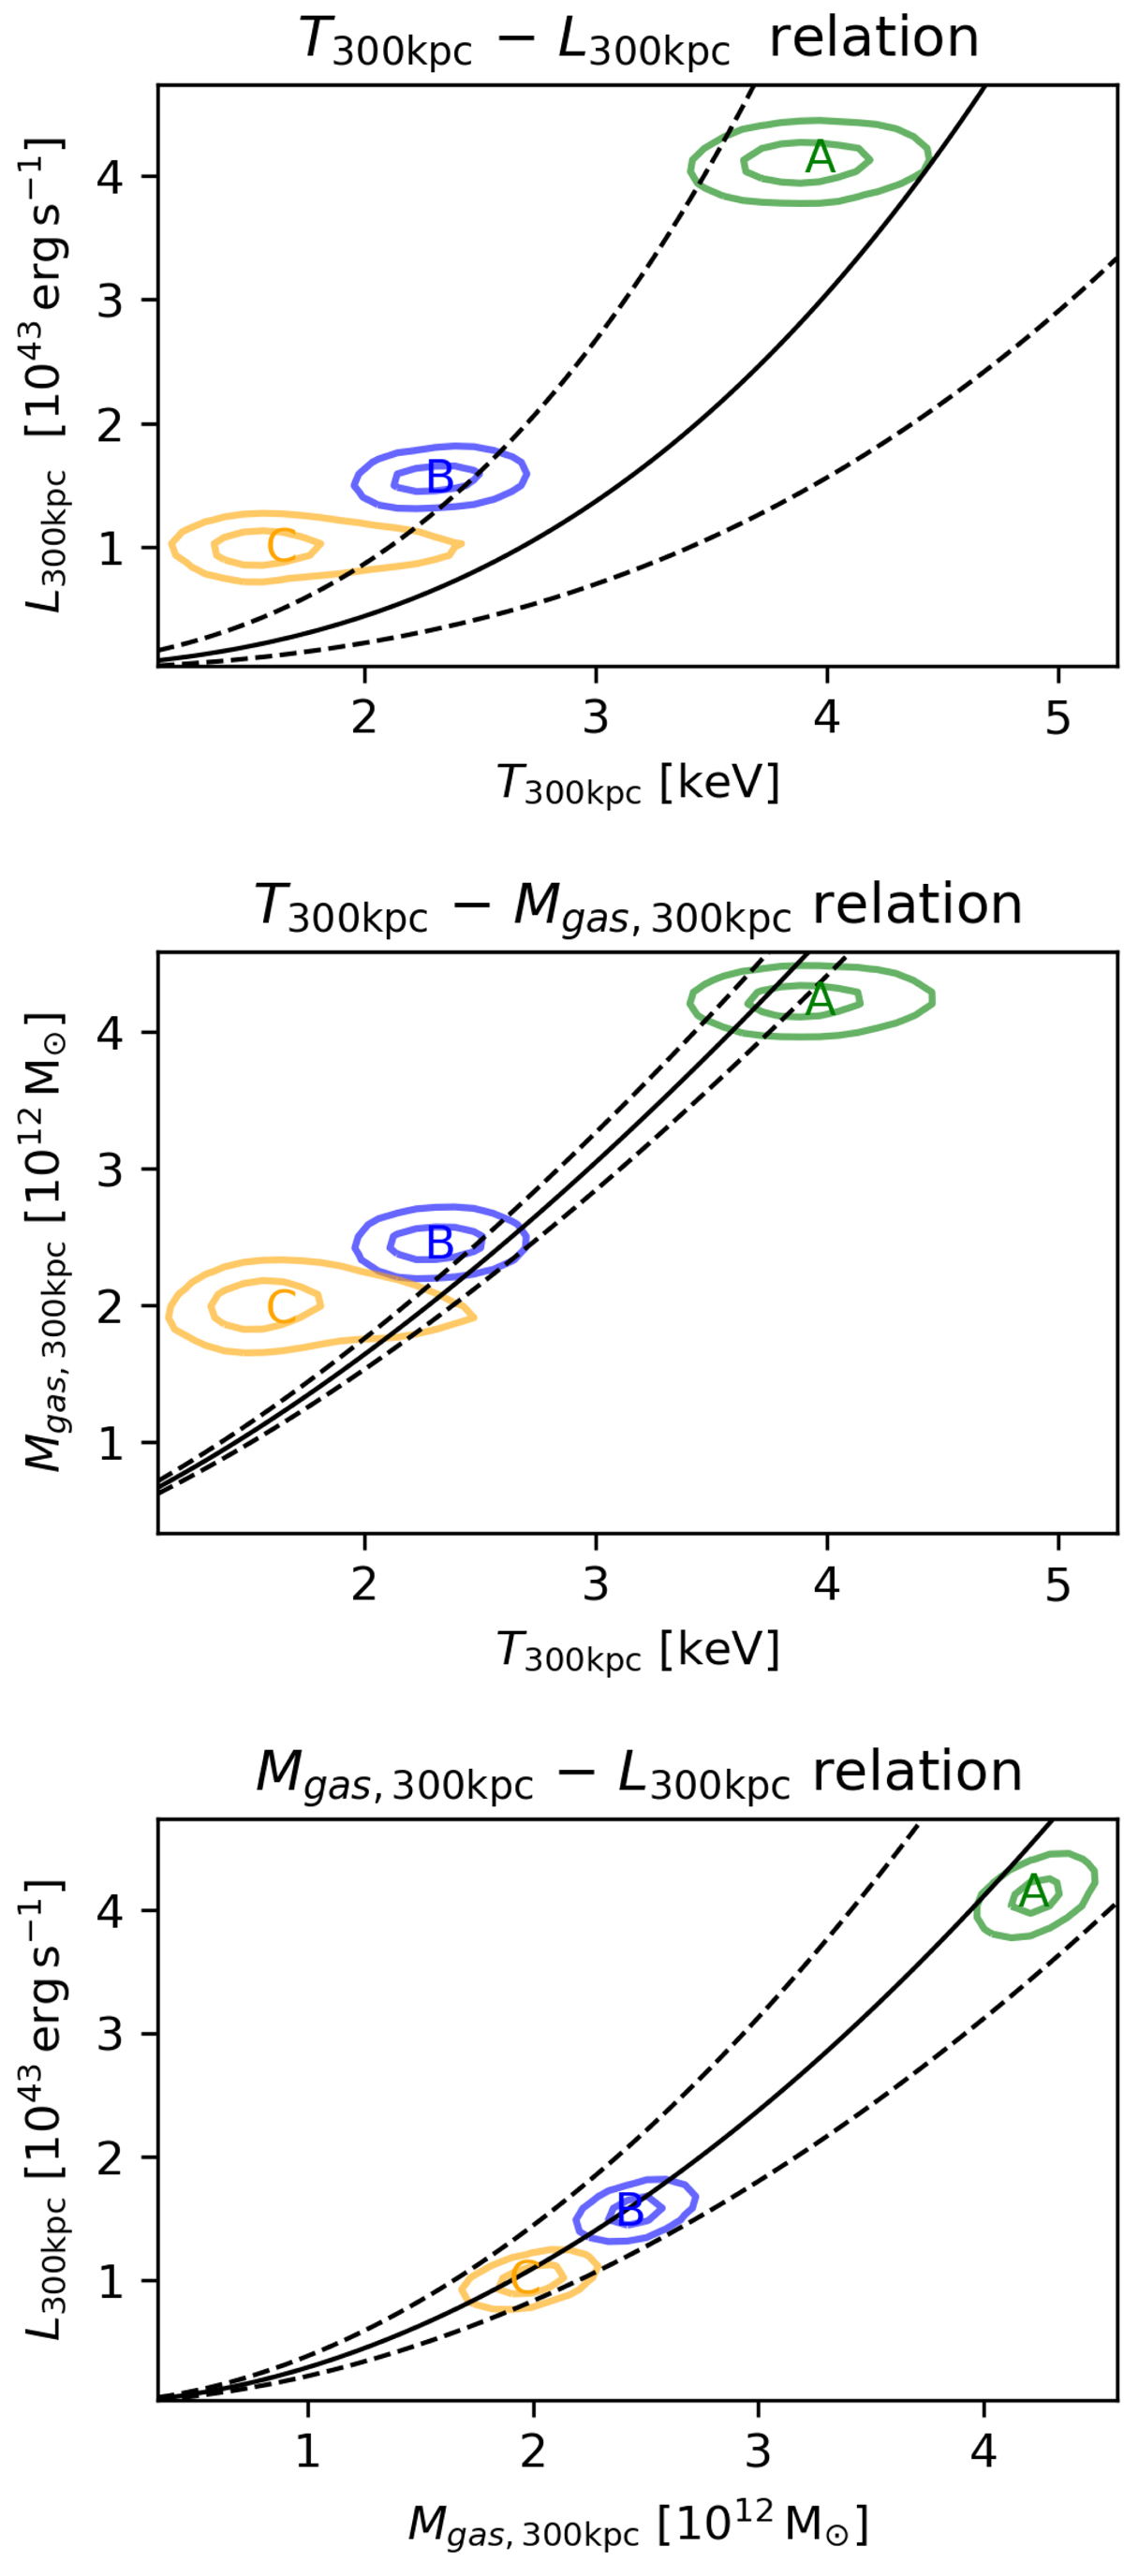
Fig. 7.
Download original image
Comparison of derived cluster parameters with scaling relations derived from the 100 brightest clusters of the XXL sample (Sereno et al. 2019). The luminosity is given for the 0.5 − 2.0 keV band and the aperture for all quantities is R < 0.3 Mpc. The black solid and dashed curves show the median and intrinsic scatter of the scaling relations, respectively. Green, blue, and orange contours correspond to clusters A, B, and C, respectively. The contours show the 1σ and 2σ levels of the isothermal beta-profile model. As the polytropic NFW-profile model has almost the same contours, they are omitted for clarity.
Current usage metrics show cumulative count of Article Views (full-text article views including HTML views, PDF and ePub downloads, according to the available data) and Abstracts Views on Vision4Press platform.
Data correspond to usage on the plateform after 2015. The current usage metrics is available 48-96 hours after online publication and is updated daily on week days.
Initial download of the metrics may take a while.