Fig. 6.
Download original image
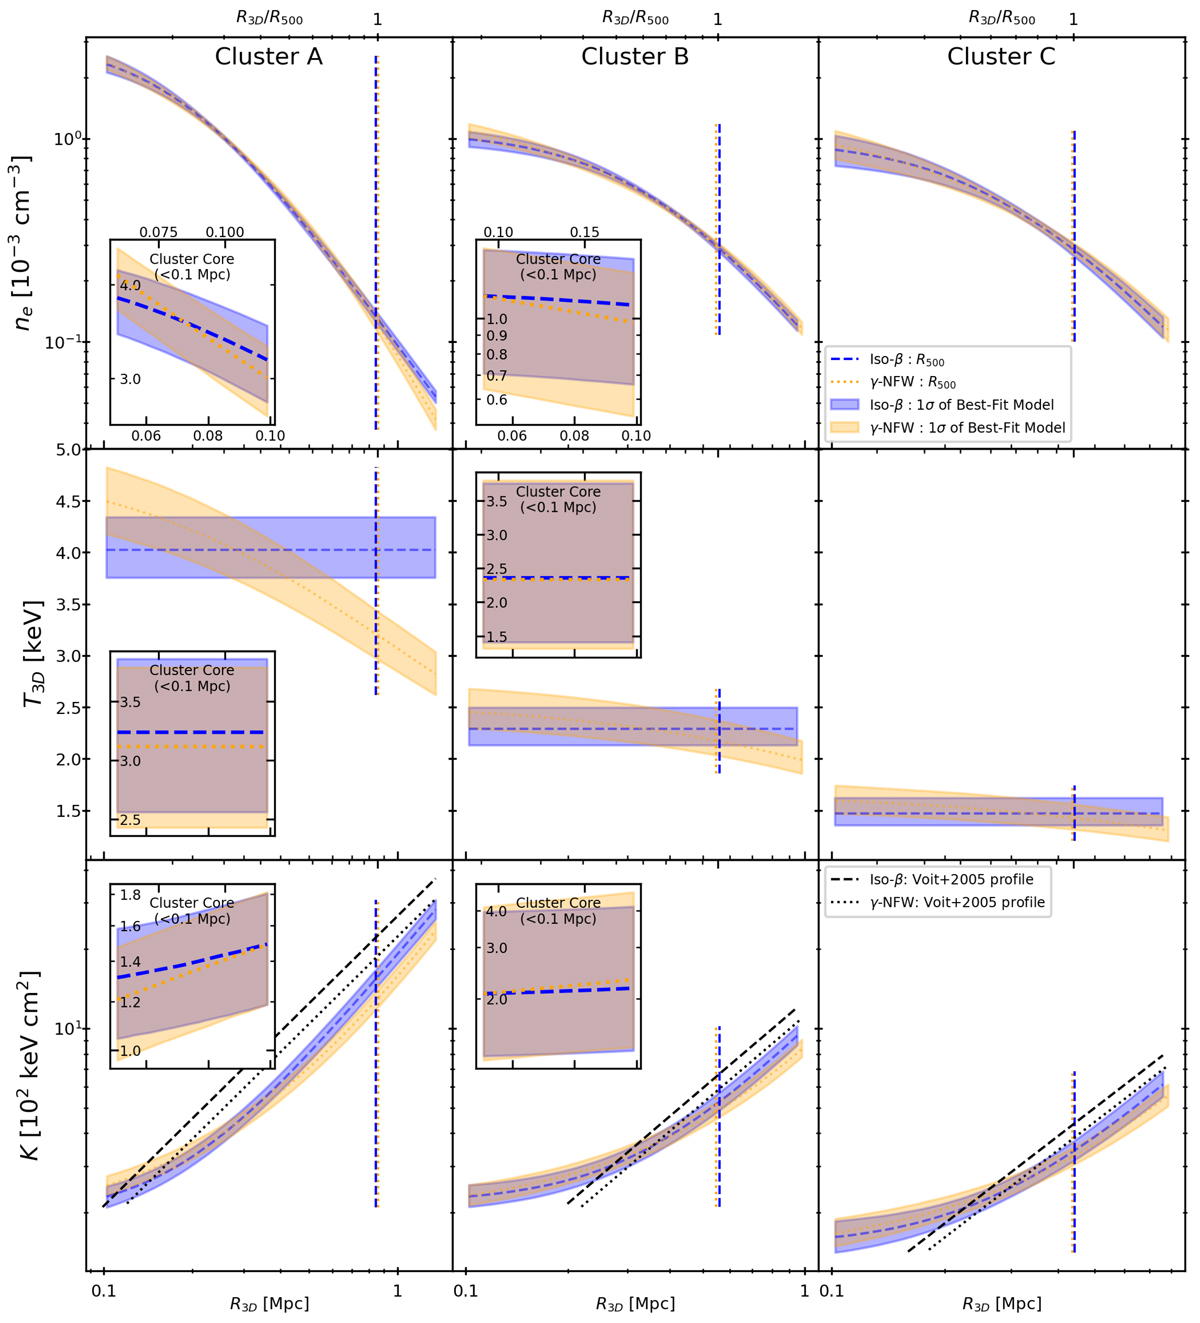
Electron number density, temperature, and entropy profiles of the best-fit model up to R200. Blue areas and dash curves show the isothermal beta-profile model (Sect. 3.3.1). Orange areas and dotted curves show the polytropic NFW-profile model (Sect. 3.3.2). Curves show the median and areas show the 1σ level of the models. The main plots show the without-core profiles (≥100 kpc) and the plot inserts show the core region (< 100 kpc). This visual separation is necessary because our model can create nonphysical discontinuities between both regions, especially for cool-core clusters (Sect. 3.3.3). For each cluster, all inserts have the same x-axis range but for clarity the tick labels are only shown in the top row. The core region of cluster C is not shown because its core-region parameters were not properly determined (Table 2). For the entropy profiles, the black lines show the self-similar prediction by Voit et al. (2005), K(r3D) = 1.32 K200 (r3D/R200)1.1.
Current usage metrics show cumulative count of Article Views (full-text article views including HTML views, PDF and ePub downloads, according to the available data) and Abstracts Views on Vision4Press platform.
Data correspond to usage on the plateform after 2015. The current usage metrics is available 48-96 hours after online publication and is updated daily on week days.
Initial download of the metrics may take a while.