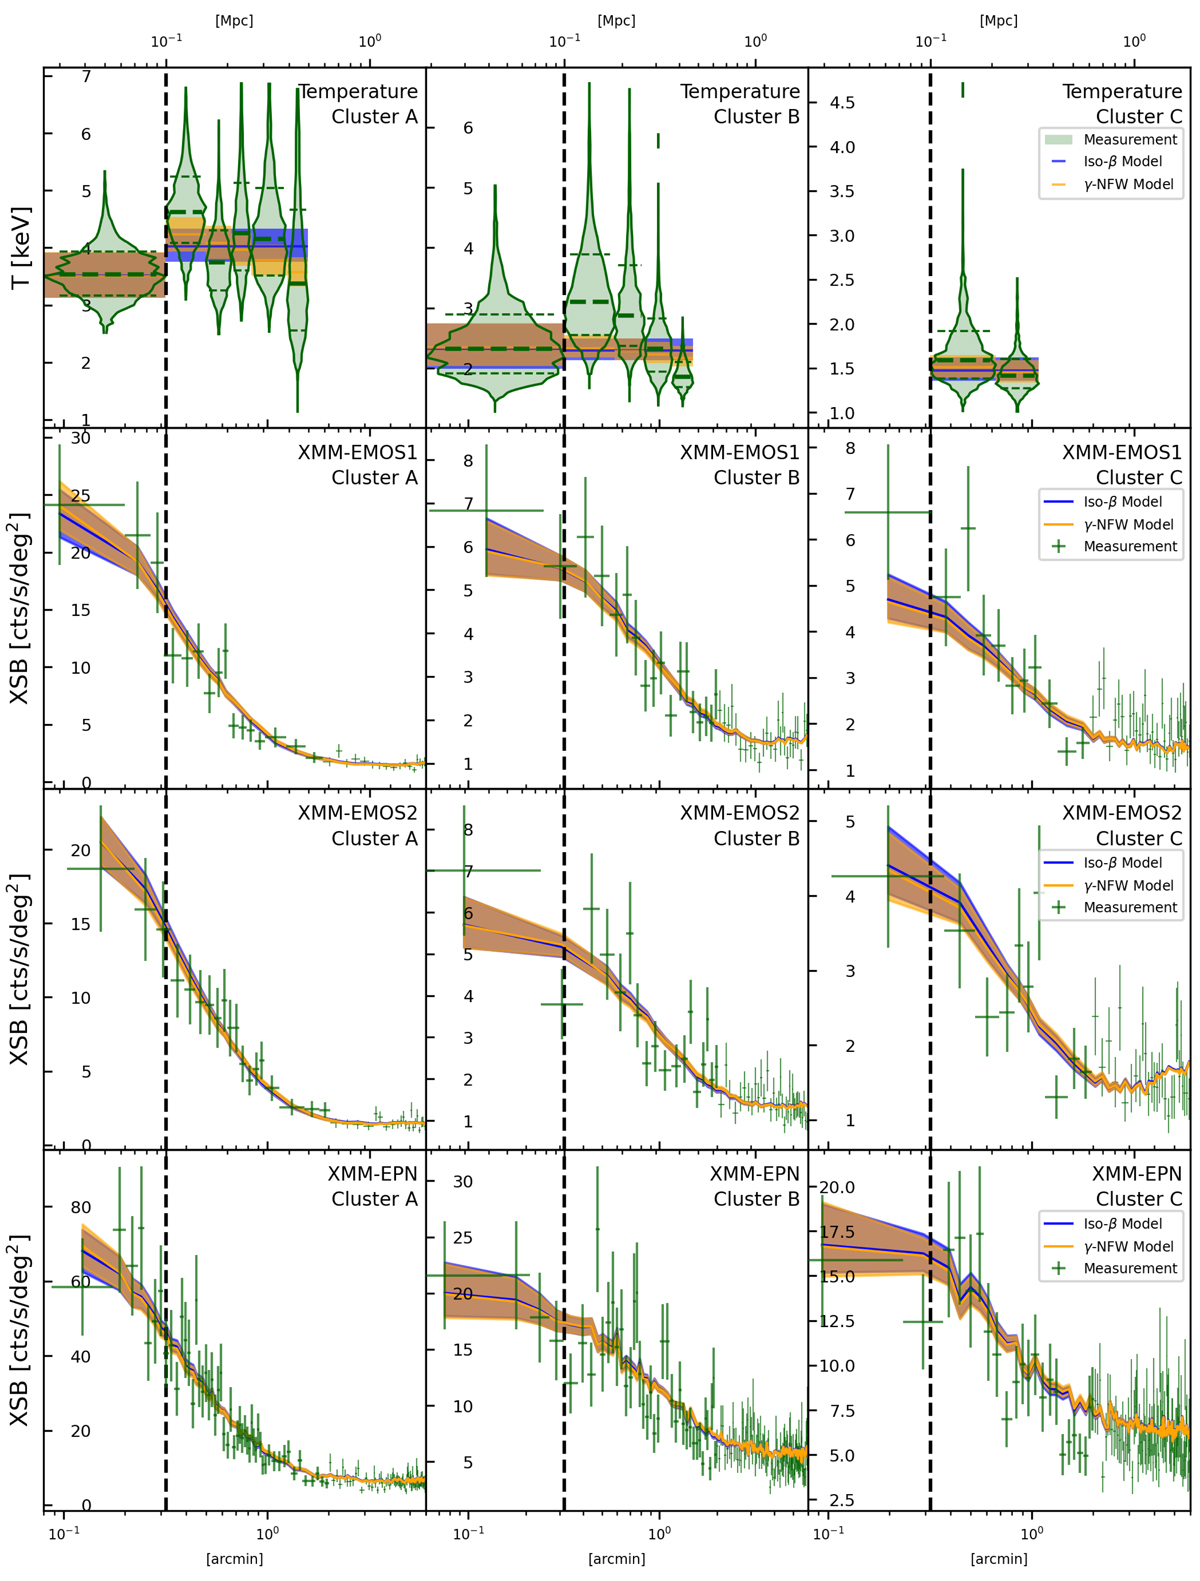
Fig. 5.
Download original image
Comparison of our measurement (green) of the XSB profiles (Fig. 2) and temperature profiles (Fig. 4) and their corresponding best-fit models (incl. 1σ level) for the isothermal beta-profile model (Sect. 3.3.1) in blue and for the polytropic NFW-profile model (Sect. 3.3.2) in orange. For visualization purposes, the thickness of the green crosses is reduced for > 2′. The posterior distributions of the best-fit model parameters are shown in Fig. C.1. The dashed vertical line shows the separation of the core region (< 100 kpc) and the without-core profile (Sect. 3.3.3).
Current usage metrics show cumulative count of Article Views (full-text article views including HTML views, PDF and ePub downloads, according to the available data) and Abstracts Views on Vision4Press platform.
Data correspond to usage on the plateform after 2015. The current usage metrics is available 48-96 hours after online publication and is updated daily on week days.
Initial download of the metrics may take a while.