Open Access
Fig. 4.
Download original image
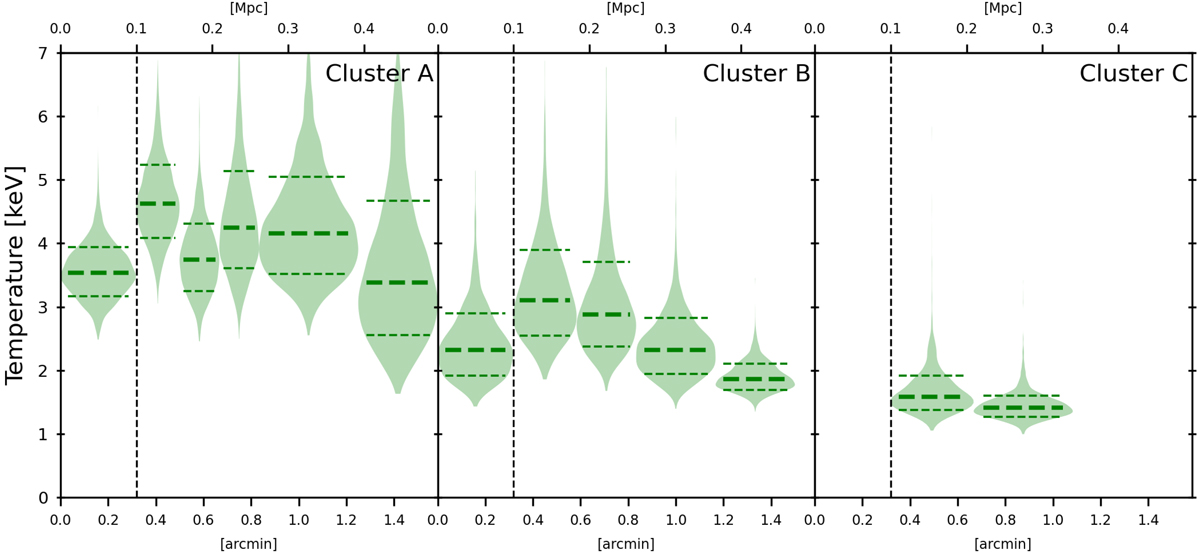
Cluster temperature profiles: Posterior distribution of the temperature after modeling the X-ray energy spectrum of consecutive profile bins of each cluster. Thick and thin dash lines are median and 1σ levels. The dashed vertical line shows the upper limit of the core region (< 100 kpc, Sect. 3.3.3).
Current usage metrics show cumulative count of Article Views (full-text article views including HTML views, PDF and ePub downloads, according to the available data) and Abstracts Views on Vision4Press platform.
Data correspond to usage on the plateform after 2015. The current usage metrics is available 48-96 hours after online publication and is updated daily on week days.
Initial download of the metrics may take a while.