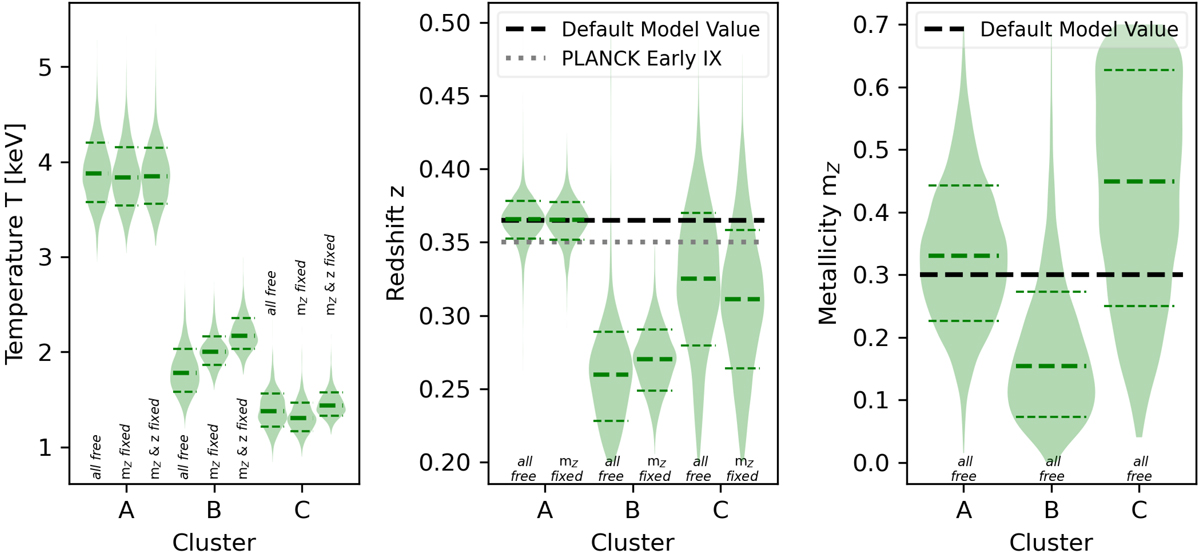
Fig. 3.
Download original image
Posterior distribution of temperature T, redshift z, and metallicity mZ after modeling the X-ray energy spectrum for a broad profile region of each cluster (Sect. 3.2.1). Thick and thin dashed green lines show median and 1σ levels. For the temperature and redshift, we show different cases, where either all parameters are free (all free) or at least one other parameter is fixed to the default value of our model, which is shown as a black dashed line in the middle and right panels. The gray dotted line in the middle panel shows the redshift estimate by PLIX2011 for cluster A based on the shallow XMM-Newton observation.
Current usage metrics show cumulative count of Article Views (full-text article views including HTML views, PDF and ePub downloads, according to the available data) and Abstracts Views on Vision4Press platform.
Data correspond to usage on the plateform after 2015. The current usage metrics is available 48-96 hours after online publication and is updated daily on week days.
Initial download of the metrics may take a while.