Fig. 2.
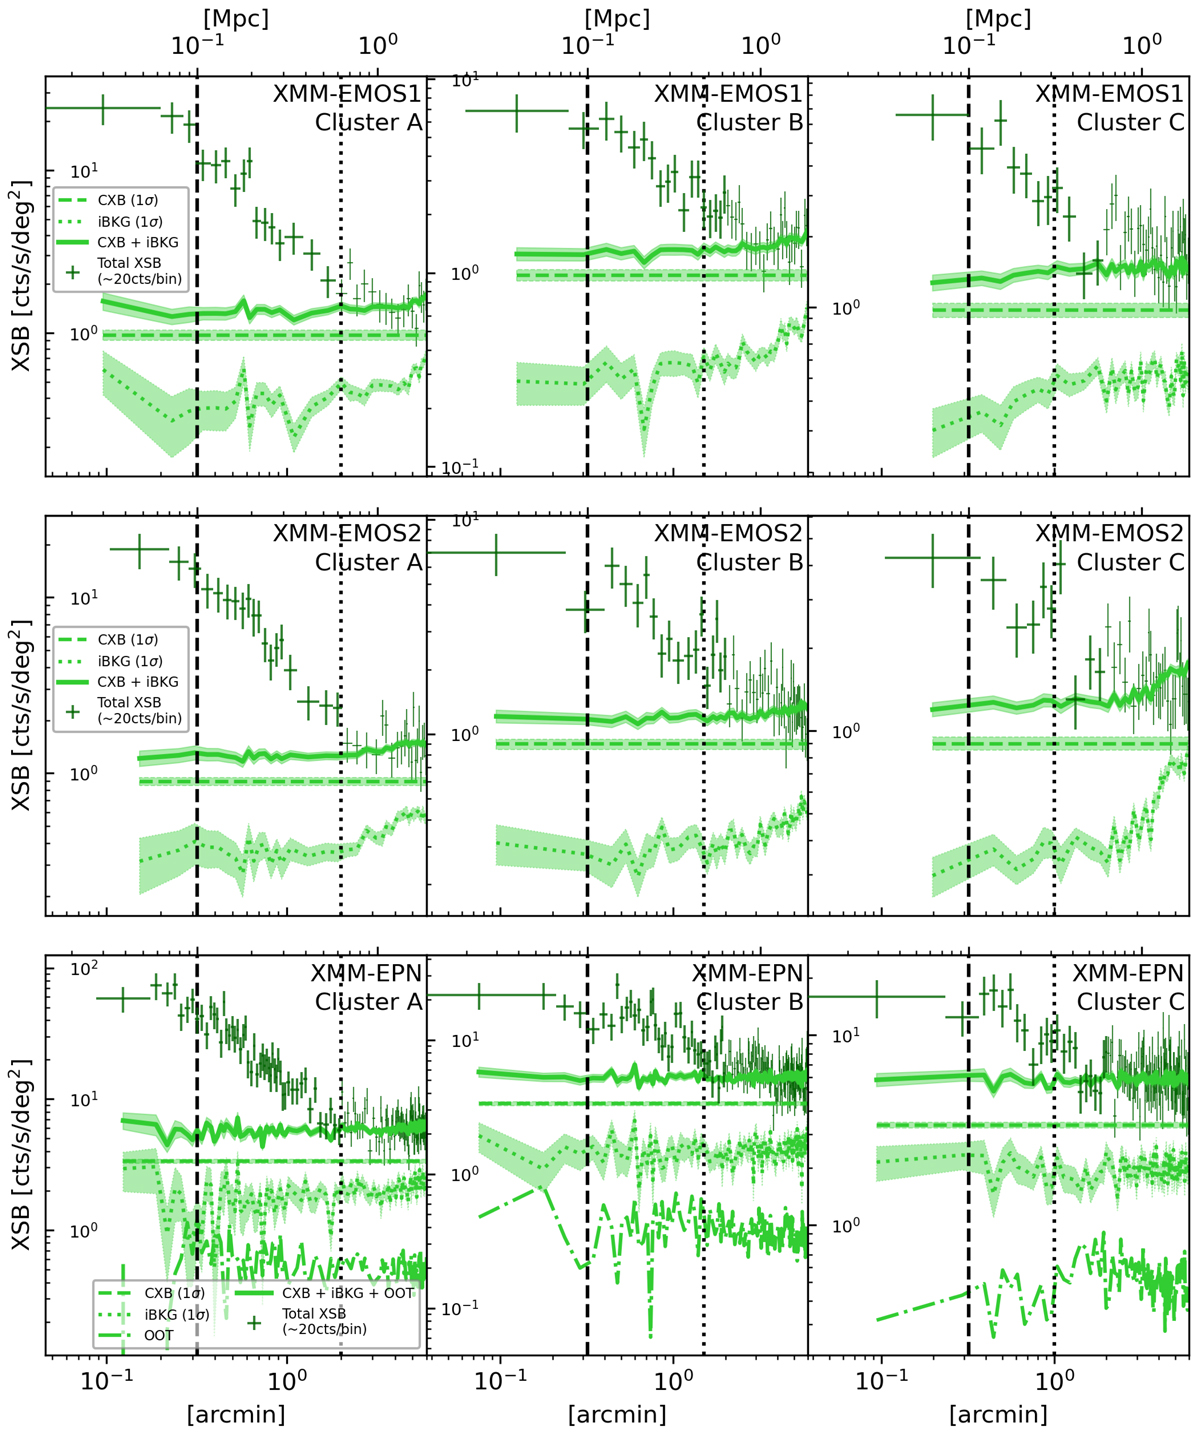
Download original image
Measured total XSB profiles from the deep XMM-Newton observation in the 0.7 − 1.2 keV band for each cluster and detector. Also shown are the independently measured background components, such as the astrophysical background (CXB, Eq. (3)), the instrumental background (IBKG, Eq. (1)), and for EPN also the expected out-of-time events (OOT). For visualization purposes, the thickness of the green crosses is reduced for > 2′. A logarithmic scale for the x-axis was used to highlight the cluster emission at small radii. The dashed vertical line shows the upper limit of the core region (< 100 kpc, Sect. 3.3.3). The scales between the dashed and dotted vertical lines are used for spectroscopy (Sect. 3.2).
Current usage metrics show cumulative count of Article Views (full-text article views including HTML views, PDF and ePub downloads, according to the available data) and Abstracts Views on Vision4Press platform.
Data correspond to usage on the plateform after 2015. The current usage metrics is available 48-96 hours after online publication and is updated daily on week days.
Initial download of the metrics may take a while.