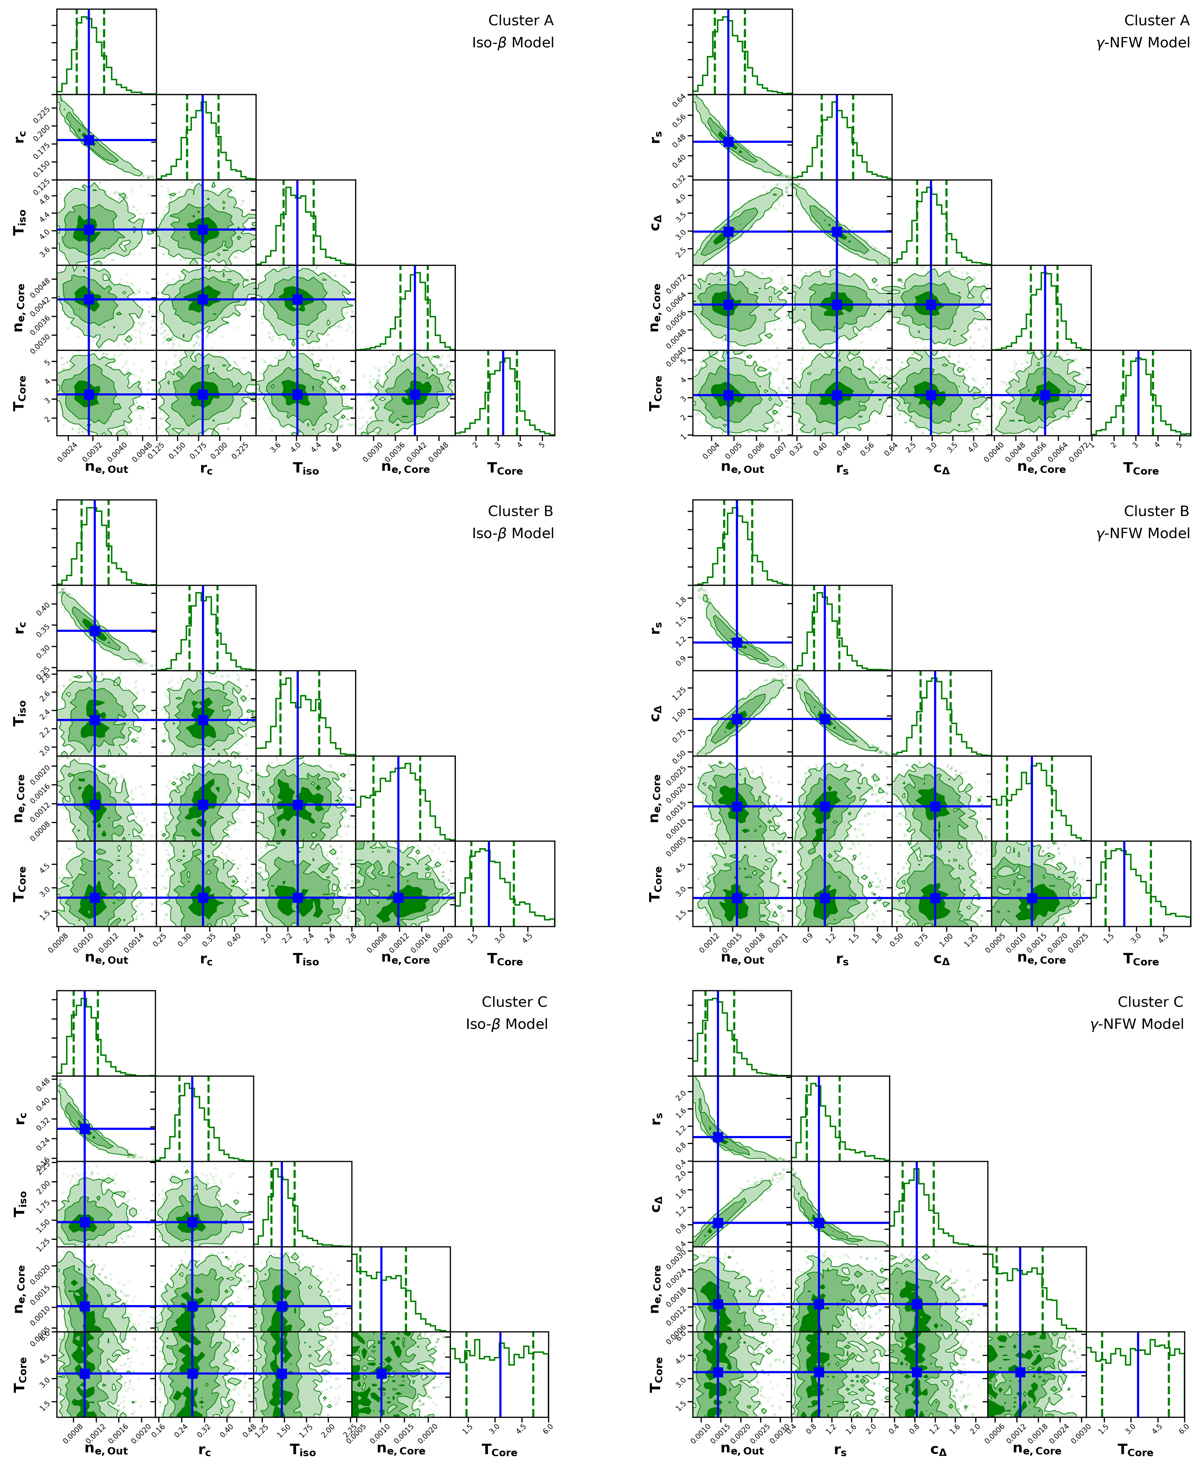
Fig. C.1.
Download original image
Posterior distribution of free cluster-model parameters from the joint fit of radial T and XSB profiles. Top, middle, and bottom rows correspond to clusters A, B, and C, respectively. Left column: Isothermal beta-profile model (Sect. 3.3.1). Right column: Polytropic NFW-profile model (Sect. 3.3.2). The blue solid lines show the median of each posterior distribution. For the 2D histograms, contours show the 1σ, 2σ, and 3σ levels. For the 1D histograms, dashed lines show 1σ levels. The free background-model parameters are omitted for clarity but they do not show any degeneracy with the cluster-model parameters.
Current usage metrics show cumulative count of Article Views (full-text article views including HTML views, PDF and ePub downloads, according to the available data) and Abstracts Views on Vision4Press platform.
Data correspond to usage on the plateform after 2015. The current usage metrics is available 48-96 hours after online publication and is updated daily on week days.
Initial download of the metrics may take a while.