Fig. A.4.
Download original image
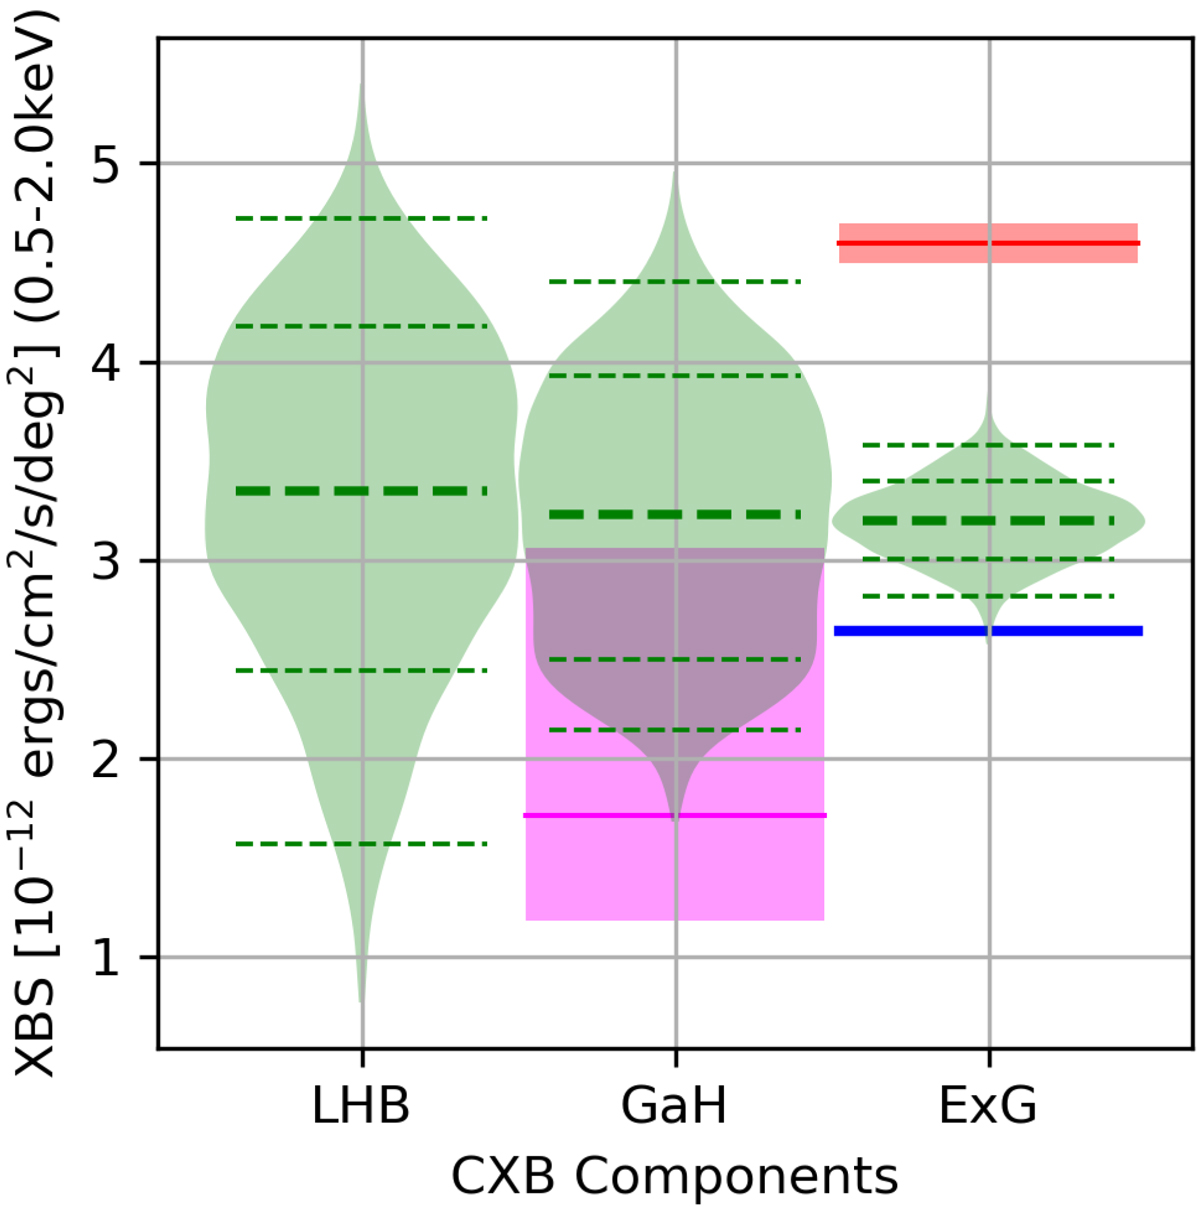
XSB of the CXB components, the local hot bubble (LHB), the Galactic halo (GaH), and the extragalactic emission (ExG), derived from the X-ray energy spectrum fit of the CXB region (Figure A.3). Thick and thin dashed lines are median and 1σ and 2σ levels. For GaH, the magenta bar shows the GaH measurement by Henley & Shelton (2013) for the southern galactic hemisphere. For ExG, the red bar shows the ExG measurement by Kolodzig et al. (2017) using the shallower survey XBOOTES, and the blue line shows the expected contribution of unresolved point sources in our observation using the log N − log S of Luo et al. (2017). These two reference values can be seen as upper and lower limits, respectively.
Current usage metrics show cumulative count of Article Views (full-text article views including HTML views, PDF and ePub downloads, according to the available data) and Abstracts Views on Vision4Press platform.
Data correspond to usage on the plateform after 2015. The current usage metrics is available 48-96 hours after online publication and is updated daily on week days.
Initial download of the metrics may take a while.