Fig. A.2.
Download original image
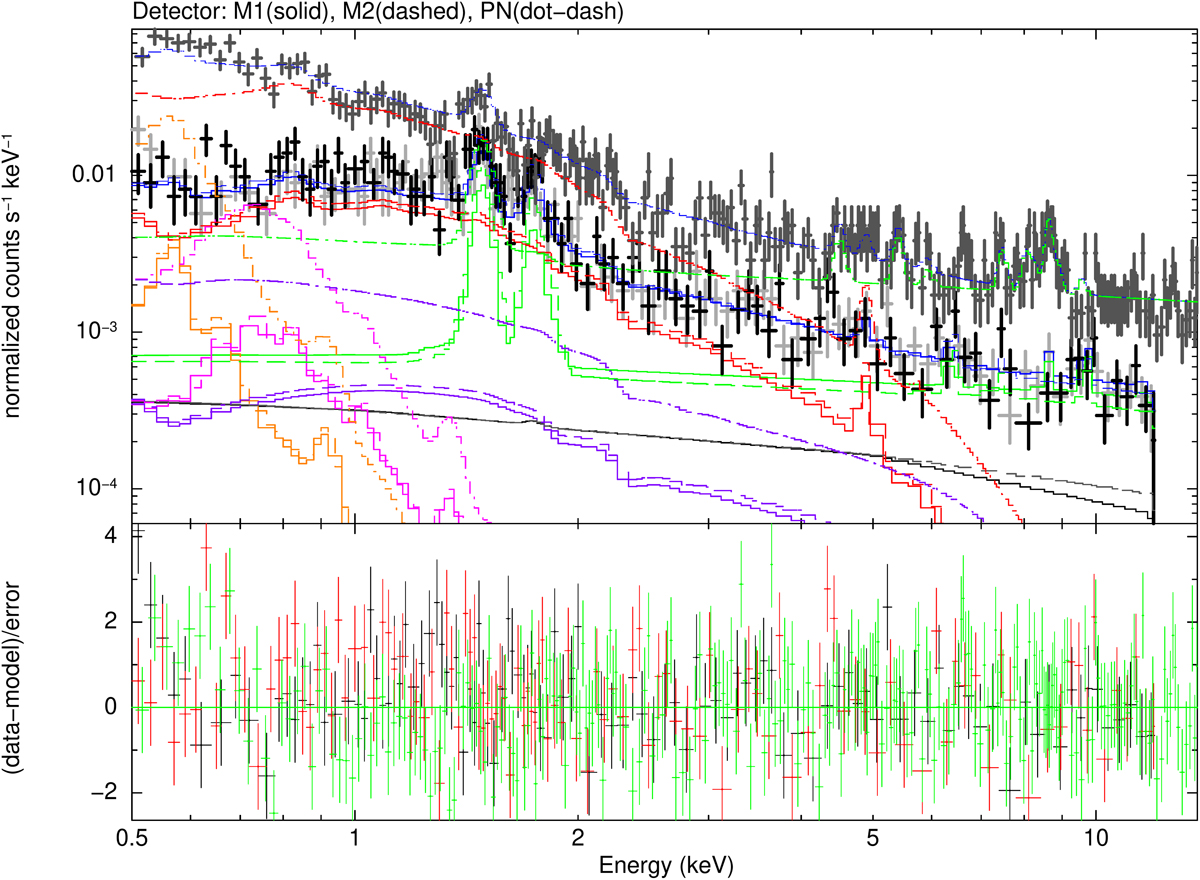
Energy spectrum of cluster A for its profile region 19″ − 2.0′≈(0.1 − 0.7)×R500 with the best-fit model of all XMM-Newton detectors of the deep observation. The same format is used here as for Figure A.1; additionally a cluster model is shown in red for each detector. Here, our best-fit CXB model (Table A.1) is used as a fixed model to determine the cluster model, as described in Sect. 3.2.
Current usage metrics show cumulative count of Article Views (full-text article views including HTML views, PDF and ePub downloads, according to the available data) and Abstracts Views on Vision4Press platform.
Data correspond to usage on the plateform after 2015. The current usage metrics is available 48-96 hours after online publication and is updated daily on week days.
Initial download of the metrics may take a while.