Fig. 5
Download original image
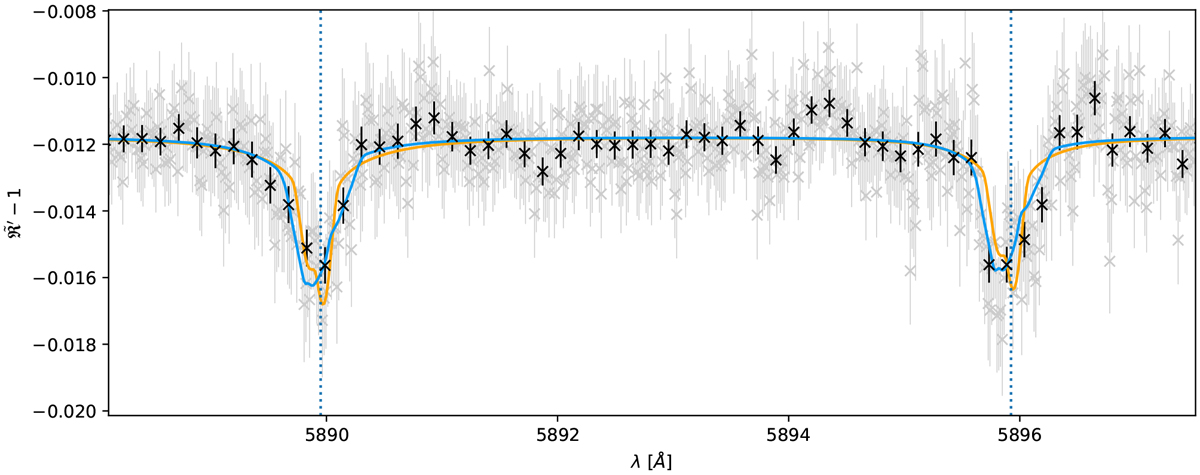
Best fit of isothermal line retrieval with an added day- to nightside wind in the lower atmosphere without a cos θ dependence and a vertical wind in the upper atmosphere in blue on the dataset in grey. The day- to nightside wind without a cos θ dependence throughout the atmosphere (moderate evidence) is shown for comparison purposes in orange. According to the Jeffrey scale, which is logarithmic, the best-fit model in blue has a probability higher than an order of magnitude than the moderate evidence model in orange. The data were binned by ten bins in black for better visualisation. The sodium doublet line centres are indicated by dashed vertical blue lines.
Current usage metrics show cumulative count of Article Views (full-text article views including HTML views, PDF and ePub downloads, according to the available data) and Abstracts Views on Vision4Press platform.
Data correspond to usage on the plateform after 2015. The current usage metrics is available 48-96 hours after online publication and is updated daily on week days.
Initial download of the metrics may take a while.