Fig. 4
Download original image
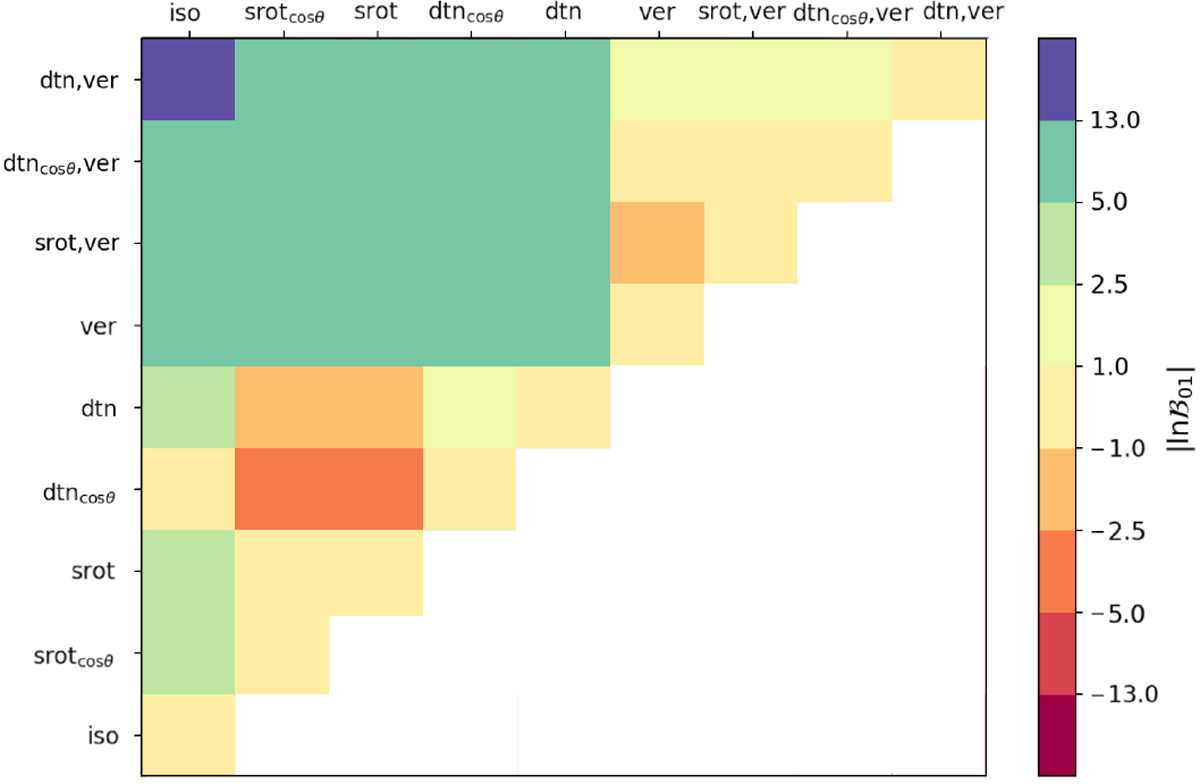
Visualisation of the difference in Bayesian evidence of Table 5. The colour scale indicates
![]() with the colours set at the different limits of the Jeffrey scale (Table 3), with strong evidence in green and the overall highest evidence in purple. The temperature gradient model is left out of the visualisation because it has a lower Bayesian evidence than even the base model. The model with the highest evidence (uniform day- to nightside wind in the lower and vertical wind in the upper atmosphere) shows strong evidence compared with all rotational models and moderate evidence with the vertical model and all two-layer models, see top row. For the exact values, see Table 5.
with the colours set at the different limits of the Jeffrey scale (Table 3), with strong evidence in green and the overall highest evidence in purple. The temperature gradient model is left out of the visualisation because it has a lower Bayesian evidence than even the base model. The model with the highest evidence (uniform day- to nightside wind in the lower and vertical wind in the upper atmosphere) shows strong evidence compared with all rotational models and moderate evidence with the vertical model and all two-layer models, see top row. For the exact values, see Table 5.
Current usage metrics show cumulative count of Article Views (full-text article views including HTML views, PDF and ePub downloads, according to the available data) and Abstracts Views on Vision4Press platform.
Data correspond to usage on the plateform after 2015. The current usage metrics is available 48-96 hours after online publication and is updated daily on week days.
Initial download of the metrics may take a while.