Fig. 3
Download original image
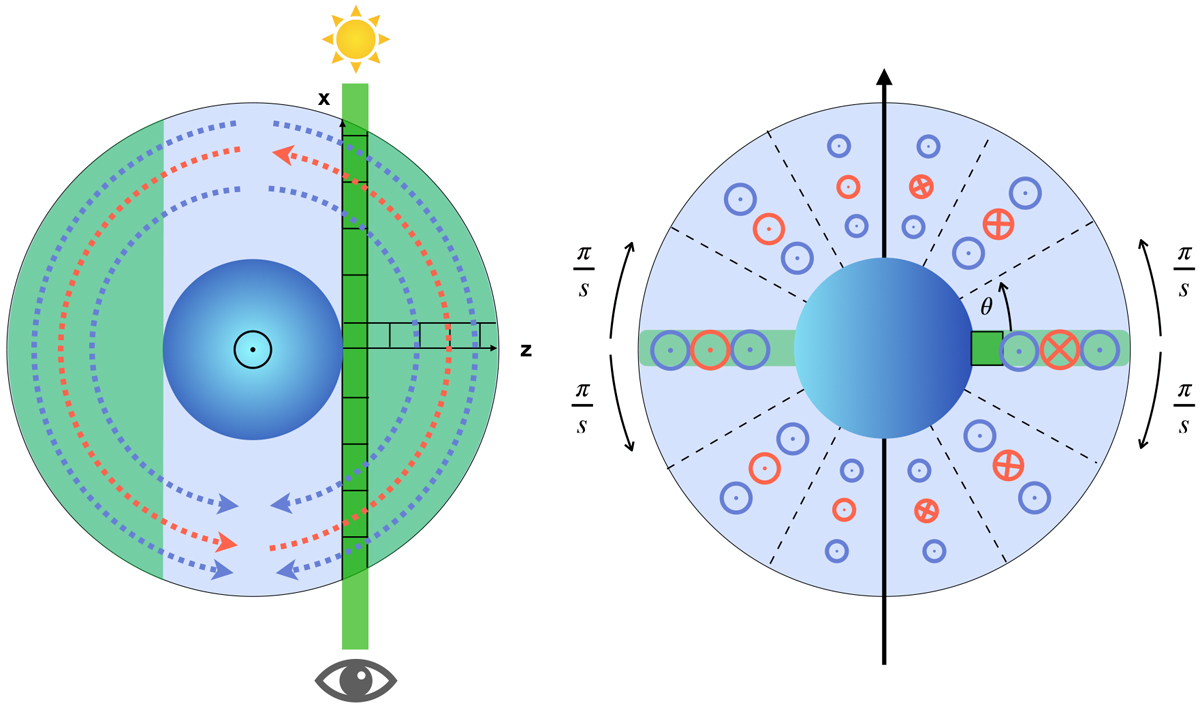
Illustration of the implementation of the day- to nightside wind (updated version of Fig. 3 from Seidel et al. 2020b). All other zonal wind patterns are implemented in the same fashion. A polar view of the atmosphere is shown on the left and an equatorial view on the right. The wind direction and strength are indicated in blue, and the direction and strength of the rotational velocity of the planet is shown in red. Dashed black lines indicate the border between sectors. For illustration purposes, we set s = 3, see text. Left: dotted arrows indicate the direction of the velocities. The extinction coefficient is calculated in altitude along the z-axis and then transposed in the x-direction along the LOS (dark green cells). The LOS is then iterated upward in z until the top of the atmosphere is reached, and all values are saved in a 2D grid (here visualised as a slice in light green). In each bin of the 2D grid, the combined velocity of wind and planet rotation and the broadened profile are calculated and stored (see Seidel et al. 2020b for more details). Right: position of the observer. Points indicate a flow towards the observer, crosses indicate a flow away from the observer. The process described on the left is repeated foreach sector, where the velocities are adjusted for the latitude via Eq. (1) and then rotated by π∕s (or π∕2s, depending on the symmetry) to create the full atmosphere. In this simplification of the atmosphere, the wind is not parallel to the equator, but points towards the anti-stellar point. This reduces calculation time significantly because it reduces the problem from 3D to 2D for each sector, with the extinction coefficient only calculated once in 1D, while providing quasi-3D insights into the wind structure.
Current usage metrics show cumulative count of Article Views (full-text article views including HTML views, PDF and ePub downloads, according to the available data) and Abstracts Views on Vision4Press platform.
Data correspond to usage on the plateform after 2015. The current usage metrics is available 48-96 hours after online publication and is updated daily on week days.
Initial download of the metrics may take a while.