Free Access
Fig. B.1
Download original image
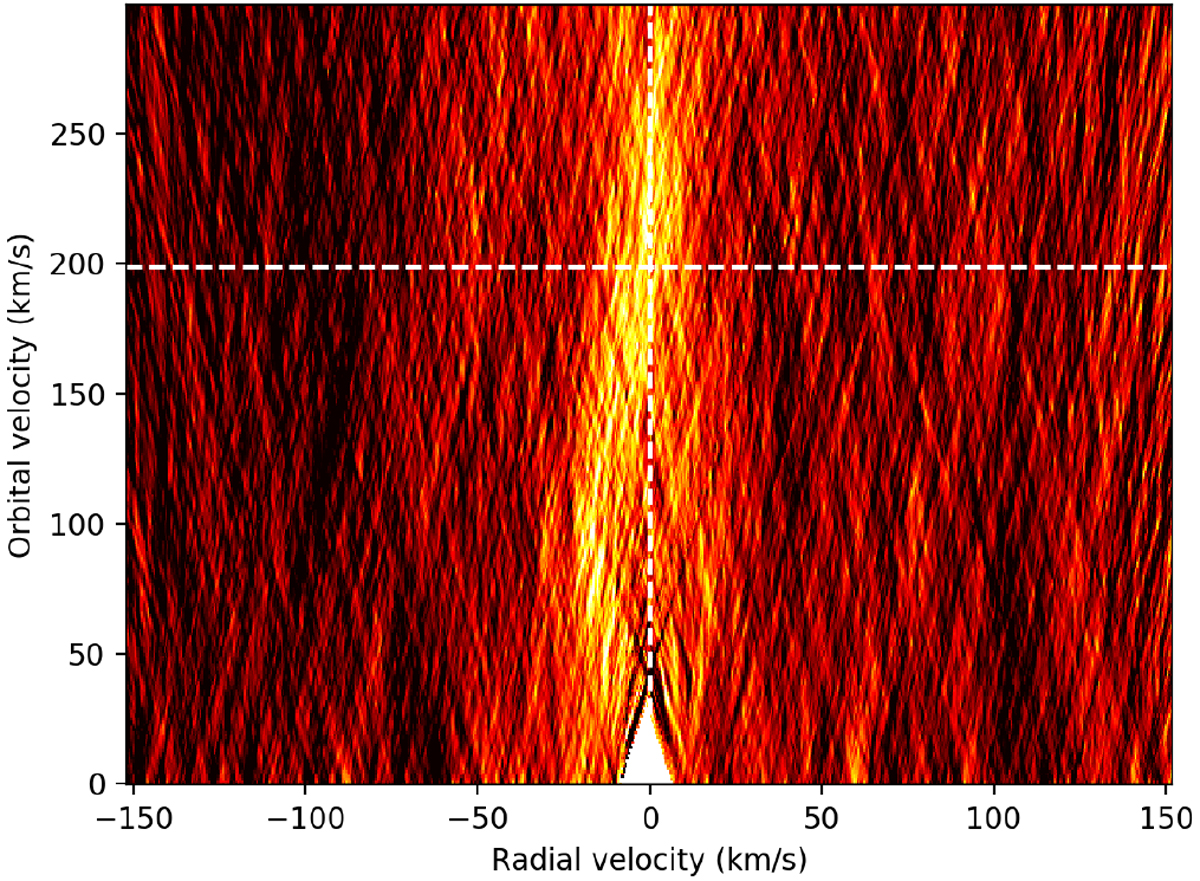
Kp-vsys map generated from the two ESPRESSO nights, the position of the sodium line as calculated in Ehrenreich et al. (2020) is indicated as dashed white lines. White areas stem from the masking of the data at the centre of the stellar sodium lines. Lighter colours indicate a stronger detection signal.
Current usage metrics show cumulative count of Article Views (full-text article views including HTML views, PDF and ePub downloads, according to the available data) and Abstracts Views on Vision4Press platform.
Data correspond to usage on the plateform after 2015. The current usage metrics is available 48-96 hours after online publication and is updated daily on week days.
Initial download of the metrics may take a while.