Fig. 8
Download original image
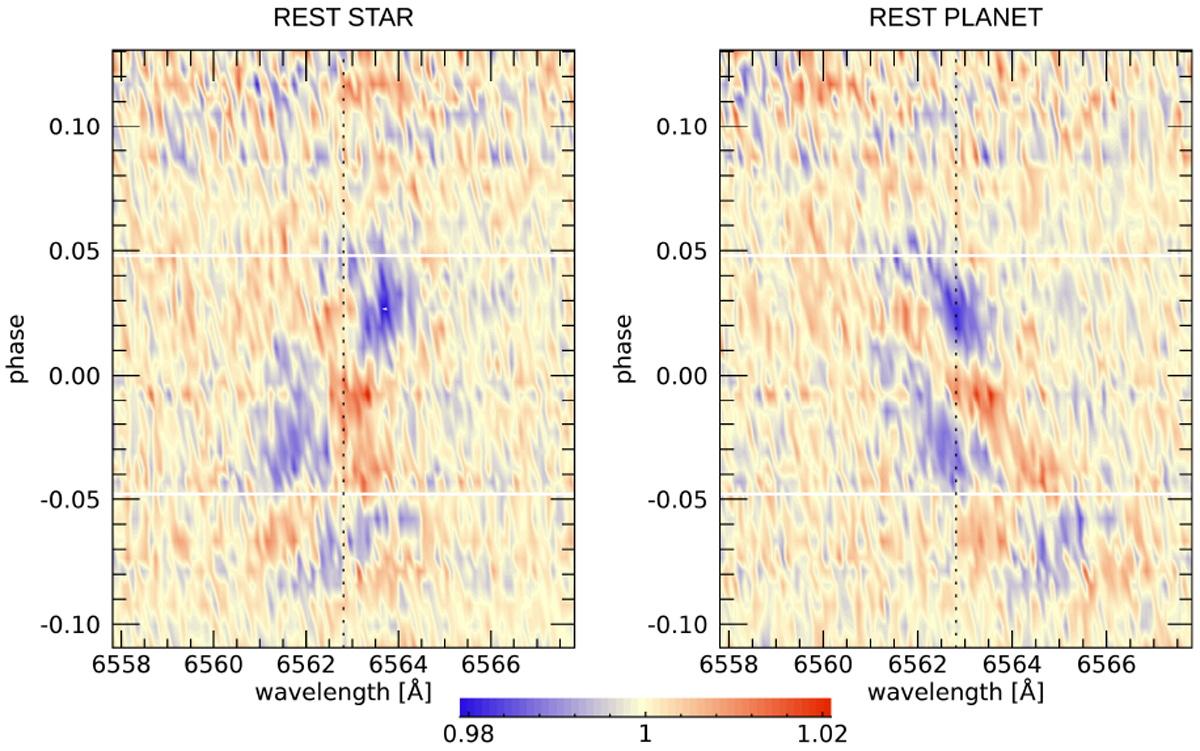
Contour 2D tomography map of Hα absorption in the stellar (left panel) and planetary (right panel) rest frames, before applying the stellar contamination correction (this also evidences the Doppler shadow, i.e. the red track). The white horizontal lines represent the beginning and end of the transit. The vertical dotted black line shows the Hα planetary rest frame in the right panel and the stellar rest frame in the left panel. A pre-transit signal, not centred in the planetary rest frame, is evident (see discussion in Sect. 6).
Current usage metrics show cumulative count of Article Views (full-text article views including HTML views, PDF and ePub downloads, according to the available data) and Abstracts Views on Vision4Press platform.
Data correspond to usage on the plateform after 2015. The current usage metrics is available 48-96 hours after online publication and is updated daily on week days.
Initial download of the metrics may take a while.