Free Access
Fig. 6
Download original image
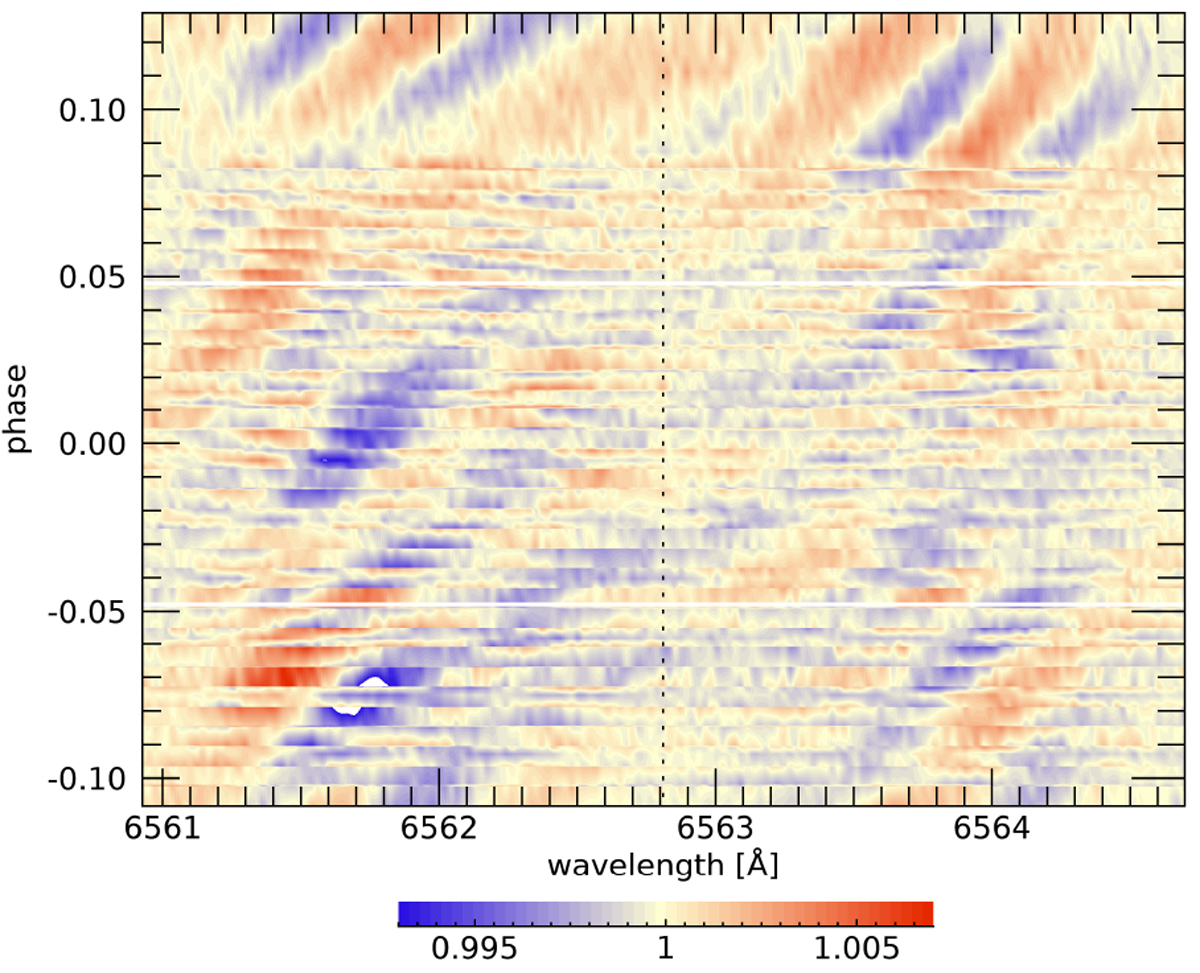
Effect of the pulsation contamination on the three analysed transits as it affects the Hα line, in the stellar rest frame. The vertical dotted line marks the position of the Hα line. The horizontal white lines show the beginning and end of the transit.
Current usage metrics show cumulative count of Article Views (full-text article views including HTML views, PDF and ePub downloads, according to the available data) and Abstracts Views on Vision4Press platform.
Data correspond to usage on the plateform after 2015. The current usage metrics is available 48-96 hours after online publication and is updated daily on week days.
Initial download of the metrics may take a while.