Fig. A.3
Download original image
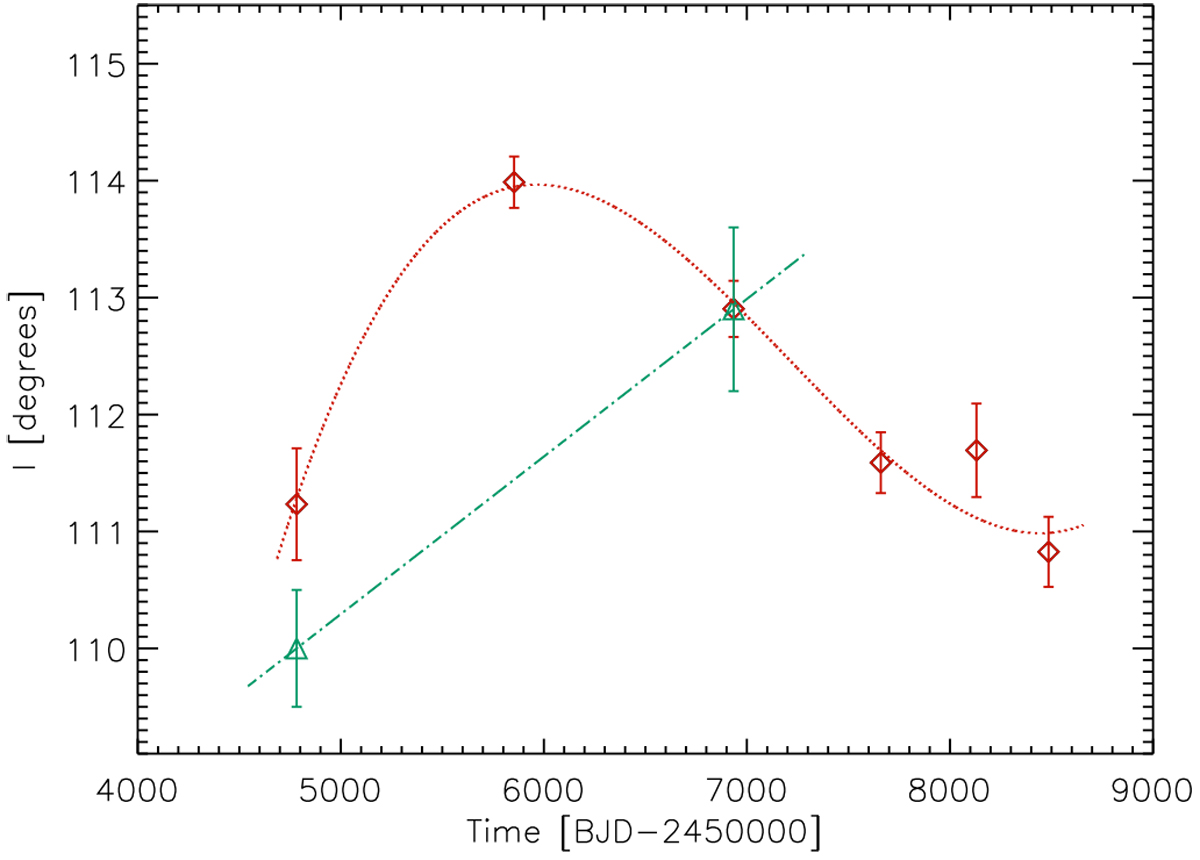
Angle I of the model by Iorio (2016) versus the time. The red diamonds are the values found from our dataset, while the green triangles are the two values derived by Iorio from the data available to him at the time of his work. We see that the precession rate dI∕dt is not constant as shown by the cubic interpolation plotted as a dotted red line. For the sake of comparison, we plot a linear interpolation between the two values available to Iorio assuming a constant precession rate.
Current usage metrics show cumulative count of Article Views (full-text article views including HTML views, PDF and ePub downloads, according to the available data) and Abstracts Views on Vision4Press platform.
Data correspond to usage on the plateform after 2015. The current usage metrics is available 48-96 hours after online publication and is updated daily on week days.
Initial download of the metrics may take a while.