Fig. 11
Download original image
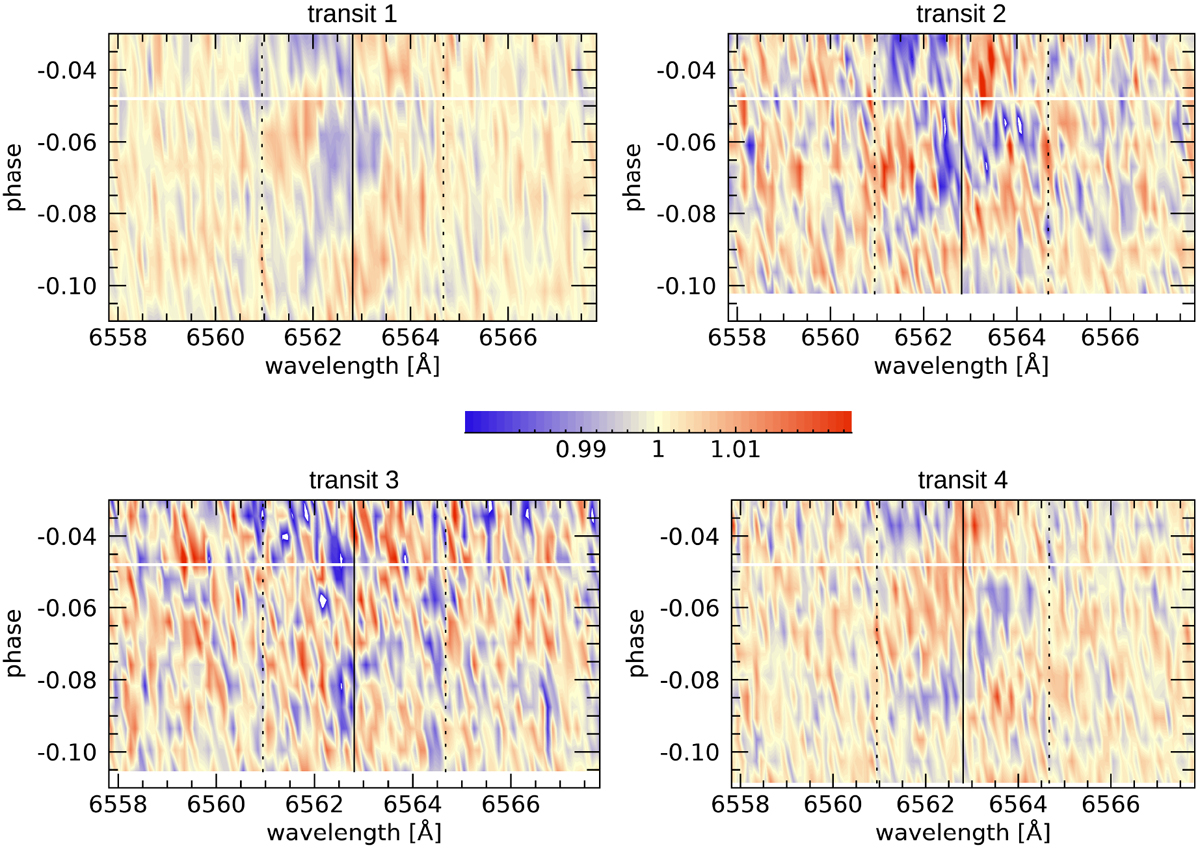
Zoom on the pre-transit signal of the four transits in our dataset, in the stellar rest frame. Vertical line shows the Hα line centre, while vertical dotted lines mark the ± v sin is limits. Horizontal white line shows the beginning of the transit. The pre-transit signal is the diagonal blue track before the beginning of the transit.
Current usage metrics show cumulative count of Article Views (full-text article views including HTML views, PDF and ePub downloads, according to the available data) and Abstracts Views on Vision4Press platform.
Data correspond to usage on the plateform after 2015. The current usage metrics is available 48-96 hours after online publication and is updated daily on week days.
Initial download of the metrics may take a while.