Fig. 1
Download original image
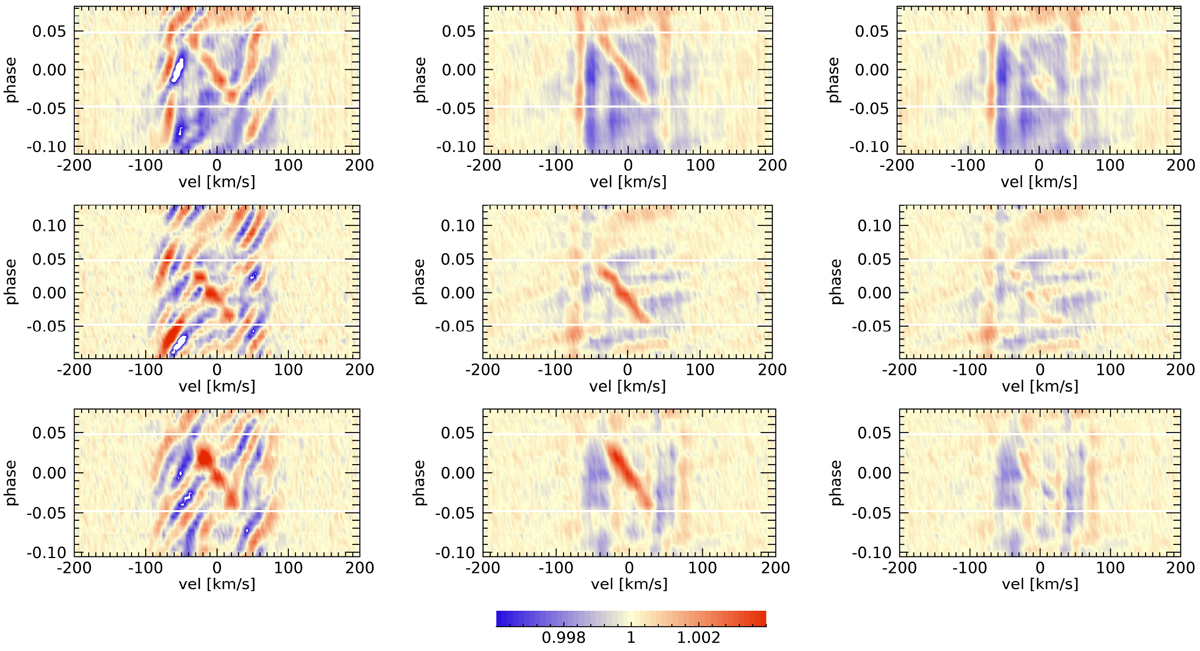
Tomography of the pulsation filtering from the mean line profile residuals. From top to bottom: transits 1, 3, and 4, respectively. Left panels: contour plot of the mean line profile residuals. Central panels: same as for left panels, but after filtering in the Fourier space. Right panels: same as for central panels, after subtracting the best-fit Doppler shadow model. The horizontal white lines show the beginning and end of the transit.
Current usage metrics show cumulative count of Article Views (full-text article views including HTML views, PDF and ePub downloads, according to the available data) and Abstracts Views on Vision4Press platform.
Data correspond to usage on the plateform after 2015. The current usage metrics is available 48-96 hours after online publication and is updated daily on week days.
Initial download of the metrics may take a while.