Fig. 1.
Download original image
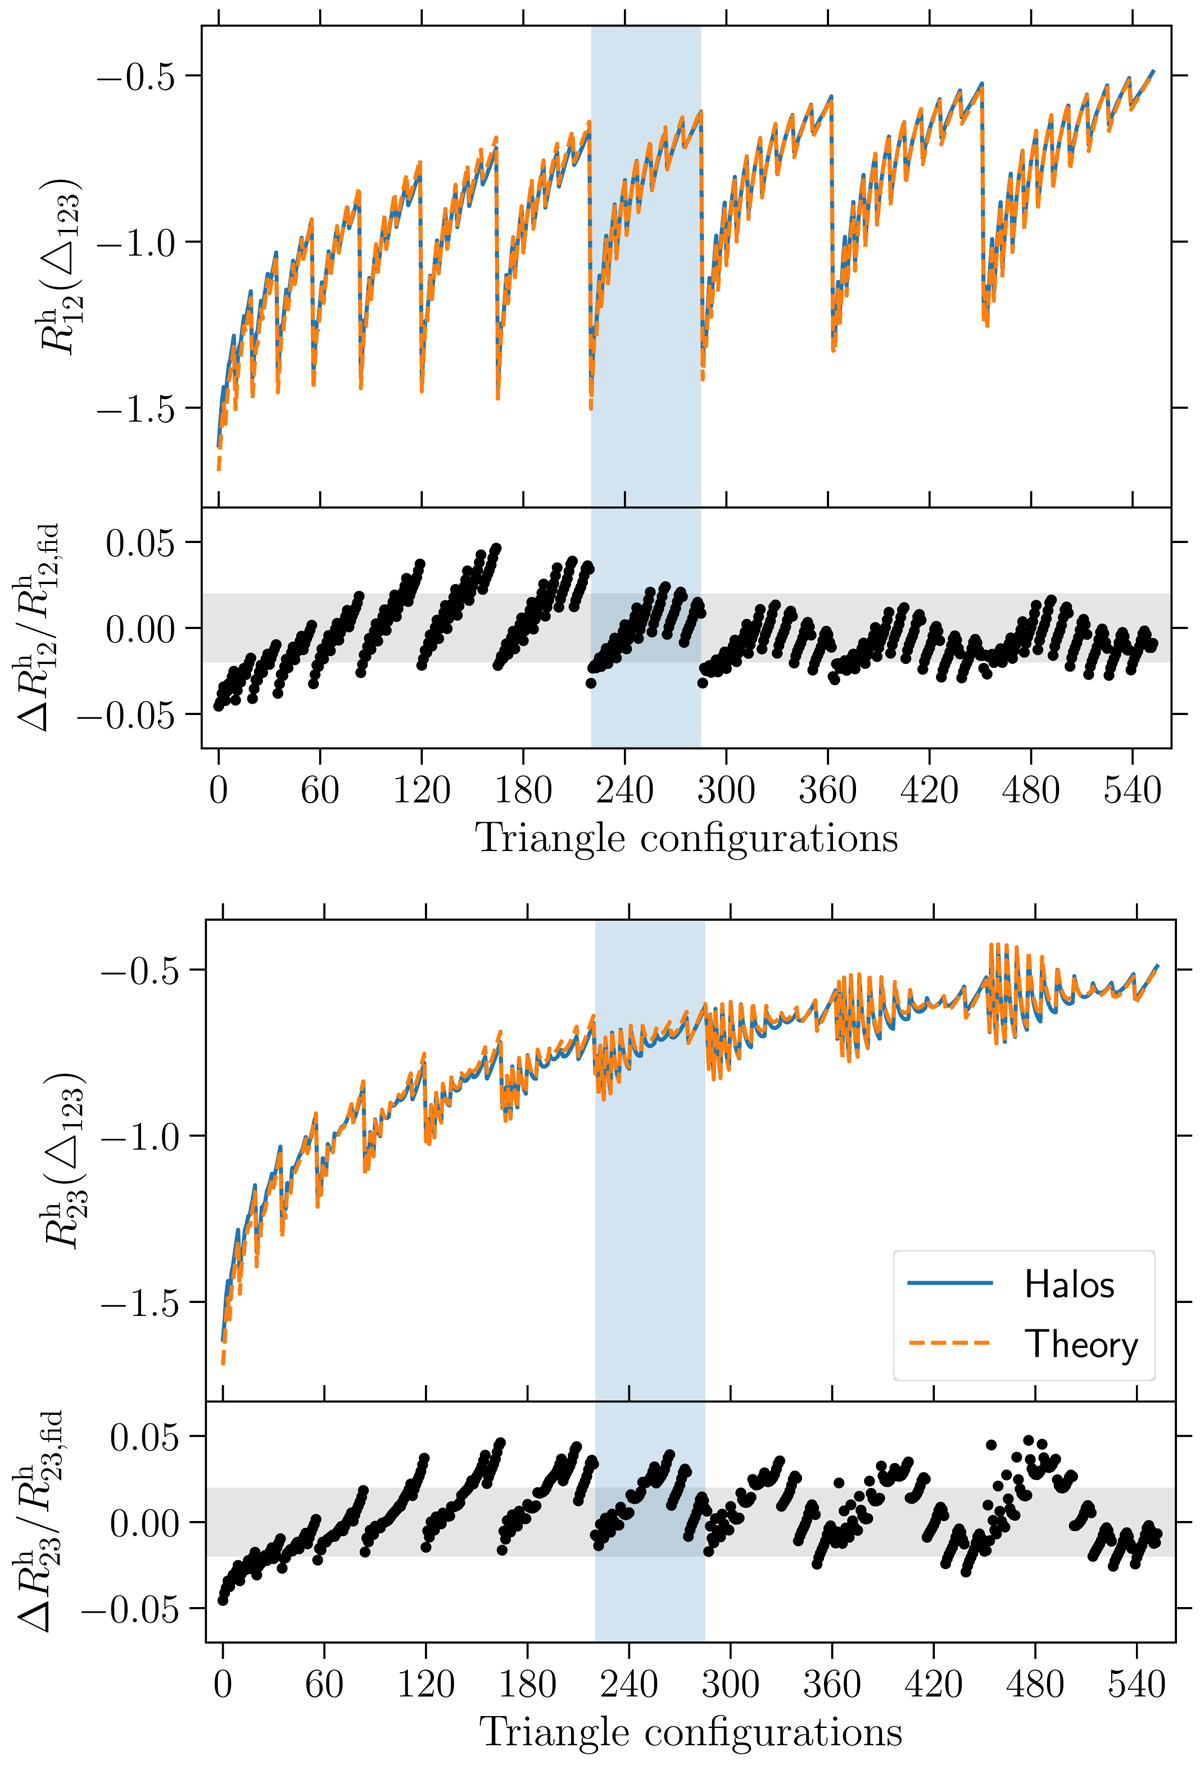
Top panel: ![]() measurement (solid line) from the halo catalogues and the analytical prediction (dashed line) using linear perturbation theory as given in Eq. (13). Bottom panel: same for
measurement (solid line) from the halo catalogues and the analytical prediction (dashed line) using linear perturbation theory as given in Eq. (13). Bottom panel: same for ![]() . The plot shows all triangular configurations, in which the minimum and maximum separations for a triangular side are 50 and 120 h−1 Mpc, respectively. Light blue vertical band corresponds to triangular configurations where one leg of the triangle is fixed, r12 ∈ (100, 105) h−1 Mpc.
. The plot shows all triangular configurations, in which the minimum and maximum separations for a triangular side are 50 and 120 h−1 Mpc, respectively. Light blue vertical band corresponds to triangular configurations where one leg of the triangle is fixed, r12 ∈ (100, 105) h−1 Mpc.
Current usage metrics show cumulative count of Article Views (full-text article views including HTML views, PDF and ePub downloads, according to the available data) and Abstracts Views on Vision4Press platform.
Data correspond to usage on the plateform after 2015. The current usage metrics is available 48-96 hours after online publication and is updated daily on week days.
Initial download of the metrics may take a while.