| Issue |
A&A
Volume 653, September 2021
|
|
|---|---|---|
| Article Number | A100 | |
| Number of page(s) | 10 | |
| Section | Extragalactic astronomy | |
| DOI | https://doi.org/10.1051/0004-6361/202140473 | |
| Published online | 15 September 2021 | |
XMM-Newton spectrum of the radio-loud quasar 3C 215: Slim accretion disk or SMBH binary
1
Gran Sasso Science Institute (GSSI), Viale Francesco Crispi 7, 67100 L’Aquila, AQ, Italy
e-mail: This email address is being protected from spambots. You need JavaScript enabled to view it.
2
Department of Physics, University of Rome “Tor Vergata”, Via della Ricerca Scientifica 1, 00133 Rome, Italy
3
INFN-Laboratori Nazionali del Gran Sasso, 67100 L’Aquila, AQ, Italy
4
Department of Astronomy, University of Maryland, College Park, MD 20742, USA
5
NASA/Goddard Space Flight Center, Code 662, Greenbelt, MD 20771, USA
6
INAF-Osservatorio Astronomico di Roma, Via Frascati 33, 00078 Monteporzio Catone, Italy
7
INFN-Tor Vergata, Via della Ricerca Scientifica 1, 00133 Rome, Italy
Received:
1
February
2021
Accepted:
28
July
2021
Abstract
Context. Radio-loud active galactic nuclei (RL AGN) exhibit very powerful jet emission in the radio band, while the radio-quiet (RQ) AGN do not. This RL-RQ dichotomy would imply a sharp difference existing among these two classes, however, modern theoretical models and observations suggest a common nuclear environment that is possibly characterized by different working regimes.
Aims. We explore the geometrical structure and mutual interactions of the innermost components of the broad line radio galaxy 3C 215, with a particular focus on the accretion and ejection mechanisms involving the central supermassive black hole (SMBH). We compare these observational features with those of the RQ Seyfert 1 galaxies. Investigating their differences is aimed at improving our understanding of the jet launching mechanisms and devising an explanation for why this phenomenon is efficient only in a small fraction of all the AGNs.
Methods. Using high-quality data from a ∼60 ks observation with XMM-Newton, we carried out a detailed X-ray spectral analysis of 3C 215 in the broad energy range of 0.5−10 keV. We modeled the spectrum with an absorbed double power-law model for the primary continuum, reprocessed by reflection from ionized and cold neutral material and modified by relativistic blurring. We also compared our results with those of earlier multi-wavelength observations.
Results. We obtained a primary continuum photon index from the corona, namely, Γ1 = 1.97 ± 0.06, along with evidence of a jet contribution, modeled as a power law with photon index of Γ2 ≃ 1.29. The reflector, which is possibly attributed to the accretion disk and portions of the broad-line region (BLR), is ionized (logξ = 2.31−0.27+0.37 erg s−1 cm) and relatively distant from the SMBH (Rin > 38 Rg), where Rg = GMBH/c2 is the gravitational radius. The obscuring torus seems patchy, dust-poor, and inefficient, while the jet emission shows a twisted and knotted geometry. We propose three scenarios to describe the following characteristics: 1. An ADAF state in the inner disk; 2. A slim accretion disk; and 3. A sub-pc SMBH binary system (SMBHB).
Conclusions. While the first scenario is not in agreement with the SMBH accretion regime, the slim disk scenario is consistent with the observational features of this radio galaxy, showing that 3C 215 is similar to non-jetted AGNs, accreting at a high rate. Nonetheless, the first two scenarios are unable to account for the particular shape of 3C 215 jet emission. The SMBHB scenario seems to be in agreement with almost all 3C 215 observational features, but we are not able to unequivocally determine this source as a strong SMBHB candidate. A final determination will require further analysis.
Key words: galaxies: active / galaxies: nuclei / quasars: supermassive black holes / accretion, accretion disks
© ESO 2021
1. Introduction
It is now widely accepted that at the center of virtually all galaxies there resides a supermassive black hole (SMBH) with a mass in the range between 106 and 109 M⊙. Through the accretion of matter, it is able to efficiently convert gravitational energy, powering the plasma in its sphere of influence and, in relatively few cases (∼1%), forming an active galactic nucleus (AGN). These sources are characterized by a high luminosity and broad-band emission ranging from the radio band to the X-ray and γ-ray, as well as significant time variability. This places AGN among the brightest and most complex sources in the Universe (Padovani et al. 2017).
According to the unified model, the peculiar emission of AGN is produced as a result of the interaction between the central accreting SMBH and some fundamental components such as the accretion disk, hot corona, broad line region (BLR), and the obscuring torus and outflows, which are considered ubiquitous in AGN (Urry & Padovani 1995). A small fraction of all the AGN (∼10%) shows an intense emission in the radio band compared to the optical. Observations reveal that these radio-loud (RL) AGN host a powerful jet emission originating in the nuclear regions, while for the radio-quiet (RQ) AGN, this is several orders of magnitude weaker or absent (Padovani 2017).
In order to produce high energy photons and relativistic particles in jets, an interaction between the magnetic field and the accretion disk is thought to be taking place in close proximity to a quickly spinning SMBH (Blandford & Znajek 1977; Ballantyne 2007); apparently, these conditions are only fulfilled in the RL sources. The exact jet-launching mechanisms are still unclear and continue to be a matter of debate, making RL AGN very interesting sources for observation and analysis. Nonetheless, this is a challenging task, given these sources intrinsically rare. Thus, for this purpose, the X-ray analysis of broad-line radio galaxies (BLRGs) constitute an important benchmark for the study of the emission and accretion mechanisms taking place in their innermost regions, near the SMBH. This class of RL AGN is relatively luminous in the X-rays and they are observed with an intermediate inclination angle that is large enough to avoid observing spectra that have been entirely dominated by the jet emission (as in the blazar class) and small enough to avoid obscuration from the torus.
By analyzing similarities and differences between BLRGs and their RQ counterparts, the Seyfert 1 galaxies, which show a very similar spectrum but an absence (or very faint) jet component, it is possible to explore what the jet production mechanisms might be and to test the so called RL-RQ dichotomy. RL AGN seem to have a smaller accretion rate (Panessa et al. 2007) and higher BH masses (Laor 2000; Chiaberge & Marconi 2011) with respect to the RQ AGN. Moreover, RL AGNs are mostly hosted in elliptical or bulge-dominated galaxies, while RQ can be found both in spirals and elliptical galaxies (Floyd et al. 2004). This suggest a connection between RL AGNs and major merger events of the host galaxies during their evolution (Ravindranath et al. 2002; Chiaberge et al. 2015).
As pointed out by Eracleous et al. (2000), BLRGs show weaker X-ray reflection signatures with respect to Seyfert 1 galaxies, with narrow or non-detectable iron lines and weak Compton reflection hump, possibly due to a particular geometry of the corona-disk system. In fact, if there is absence of matter in the innermost region of the accretion disk (i.e., a truncated disk) or an advection dominated accretion flow, namely, an ADAF disk (Narayan & Yi 1994, 1995; Narayan & McClintock 2008; Abramowicz & Fragile 2013), the solid angle over which the outer standard thin disk is illuminated is relatively small, leading to an overall weakening of the reflection features.
Ballantyne et al. (2002) state that also the reprocessing from a highly ionized accretion disk (ξ ∼ 4000 erg cm s−1) can suppress the reflected spectrum, going on to argue that this phenomenon is not strictly correlated to a particular geometry and that a standard thin accretion disk may also account for this.
There is also evidence that BLRGs have harder X-ray spectra with respect to their RQ counterparts (Grandi et al. 2006). Nevertheless Sambruna et al. (1999) showed only a weak indication of a flatter spectrum in a BLRG.
Two important parameters that can be of a pivotal importance in testing the radio-loud-radio-quiet dichotomy are the Eddington parameter λ = Lbol/LEdd (where Lbol is the bolometric luminosity and LEdd is the Eddington luminosity) (Ballantyne 2007) and the dimensionless black hole spin parameter a = cJ/GM2. Recent observations indicate a direct proportional relation between the jet power and the spin parameter, suggesting that rapidly spinning SMBHs are more likely to form powerful jets (Moderski et al. 1998).
Garofalo et al. (2010, 2014) propose a different theoretical framework, arguing that the jet formation mechanism is not triggered by the intensity of the SMBH rotation, but the mutual rotational directions between the black hole and the accretion flow, favoring the formation of jets in the case of retrograde rotation (a < 0). This may explain the observational evidence of a low fraction of RL AGN at low redshift. In addition, merger episodes, which cause an high accretion rate and retrograde flows, can explain how RL AGNs are formed and why they are commonly observed in elliptical galaxies that have a high probability of having experienced at least one significant merger event in their past evolution.
The jet formation mechanism can be described by a disk+jet model linked to a jet duty-cycle. According to this model, the accretion disk, which is initially intact down to the innermost stable circular orbit (ISCO), is internally disrupted because of disk instabilities and ejects matter that constitutes the jet and outflows. After this, the accretion disk refills and the cycle starts again.
This model, proposed by Lohfink et al. (2013), is in agreement with their multi-epoch observations of a BLRG caught both in the ejection and refilling stages, making it possible to consider BLRGs observed in different stages of their jet cycle and exhibiting different observational features.
Recent models, supported by new X-ray observations, claim that the nuclear regions of BLRGs and Seyfert 1 are composed by very similar components that interact with the same physical phenomena but at different regimes (Ballantyne et al. 2014; Ursini et al. 2018a).
2. 3C 215
3C 215 is a BLRG with a cosmological redshift z = 0.412, measured through optical emission lines. This source has been observed different times over the years, covering a large fraction of the electromagnetic spectrum, but with little information in the X-ray band. In the following, we describe the most important characteristics of 3C 215 obtained from the literature.
The 3C 215 host galaxy is elliptical (Lehnert et al. 1999) and it is probably interacting with a companion galaxy at ∼28 kpc, in a clustered environment of a radius ∼30 arcsec containing at least 14 other galaxies (Márquez et al. 1999). Therefore, it is likely that during its lifetime, this galaxy experienced at least one major merger episode, which led the gas in the disk to be expelled or accreted (or both).
Tang et al. (2012) observed the optical/UV emission lines and measured their flux, equivalent width (EW), and full width at half maximum (FWHM) for broad and narrow emission lines in this wave-band, notably the CIV, MgII, and Hβ emission lines. They computed three different estimates of the black hole mass MBH through empirical mass scale relations (Vestergaard & Peterson 2006; Vestergaard & Osmer 2009), adopting the median value for the black hole mass log MBH = 8.92 ± 0.5.
Labita et al. (2006) observed a sample of quasi-stellar objects (QSOs), including 3C 215, in the UV band with the Hubble Space Telescope (HST) measuring the CIV line width and the host galaxy luminosity. These authors computed the black hole mass using the MBH − Lbulge relation (Bettoni et al. 2003) and by comparing this mass estimate with the virial theorem, they calculated the geometry factor of the BLR f = 1/3, indicating a disk-like BLR geometry.
Decarli et al. (2008) further analyzed the previous sample, while additionally considering the Hβ line. Unfortunately, 3C 215 was excluded from the sample because of its low signal-to-noise ratio (S/N), but what they found for the sample is a stratified BLR, with an inflated disk-like region that produces the CIV emission line and an isotropic region that produces the Hβ emission line, similar to what was found by Labita et al. (2006) with the CIV line.
Decarli et al. (2010) analyzed the same sample with different observatories and obtained an independent black hole mass trough the virial theorem. They obtained the same MBH estimate of Tang et al. (2012), so this is the value that we will consider in this work.
Runnoe et al. (2013) carried out a SED analysis from the IR to the X-ray band, obtaining important parameter values related to this source, such as the bolometric luminosity, log Lbol ≃ 45.77 erg s−1, the spectral index between the optical and the X-ray band, αox ≃ −1.04, the observable ratio between mid-IR and bolometric luminosity, log R ≃ −1.521, and the obscuring torus covering fraction, c ≃ 64%, which is estimated using the IR flux.
Reeves & Turner (2000, R&T00) and Hardcastle et al. (2006, H06) both carried out with different telescopes an X-ray analysis of 3C 215 in the 2−10 keV band, but with the low S/N data available to them, they could only measure the luminosity in the X-ray band, LX, and the photon index, Γ. Their work is discussed in more detail in Sect. 5.3.
The radio band observations of 3C 215 are ambiguous (Bridle et al. 1994; Gilbert et al. 2004; Fernini 2007). This source lies in a highly dense clustered environment and shows a knotty and twisted jet, tilted by almost 90° with respect to the lobes (see Figs. 1 and 2).
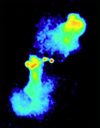 |
Fig. 1. VLA A+B image of 3C 215 at 4860 MHz (Bridle et al. 1994). |
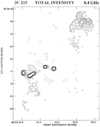 |
Fig. 2. VLA B contour map of 3C 215 at 8.4 GHz (Fernini 2007). |
The plume structure in the southern lobe is more similar to a Fanaroff-Riley (FR) I source, while the northern lobe resembles FR II features. The particular environment of 3C 215 is probably one of the reasons behind this particular behavior and it can interfere with the jet at scales of ∼10 kpc. However, to account for this complex structure, there have to be several additional phenomena taking place in the inner region of the AGN where the jet is formed, such as a warped accretion disk or a secondary SMBH.
3. Data reduction
3C 215 was observed with XMM-Newton in April 17−18, 2012. In this work, in order to acquire a better S/N, we used data from the EPIC-pn, EPIC-MOS1 and EPIC-MOS2 detectors with total exposures of 59.6 ks and 61.2 ks for the pn and MOS cameras, respectively. The data reduction and analysis were carried out using the SAS standard procedure. We checked for the presence of soft proton flaring events in the dataset, with energies between E = 10−12 keV. We produced a light curve in the same energy range, excluding all the time intervals with a count rate that exceeds the values 0.7, 0.3 and 0.25 for the EPIC-pn, MOS1, and MOS2 datasets, respectively.
Afterwards, we defined a circular region that encircles the source, with radii of 40″ and 44″ in the EPIC-pn and MOS CCDs, respectively. We repeated the same procedure with the background region, considering different portions of the same CCDs with a uniformly distributed number of photons for each pixel. In addition, we tested the presence of pile-up effects, excluding data contamination.
Using the SAS tools we produced redistribution matrix files (RMFs), ancillary response files (ARFs), and cleaned X-ray spectra in the energy range of E = 0.5−10 keV, grouped with a minimal threshold of 25 photons per bin.
4. Spectral analysis
To analyze the spectrum obtained through the data reduction, we used the package XSPEC (v. 12.10.1) from the software Heasarc (v. 6.26.1), which allowed us to analyze the spectrum using a standard spectral fitting method with χ2 statistics. The errors reported in this analysis are computed with a 1σ confidence level, while the upper and lower limits are reported at a 90% confidence level.
Since we are using a combined spectrum produced from data from three different cameras, we took into account the cross-calibration differences between the EPIC-pn and EPIC-MOS devices through a cross-calibration parameter, k. Fixing k = 1 for the EPIC-pn spectrum, we found from the EPIC-MOS spectral fit, kmos = 1.011, which is henceforth considered fixed. This indicates a difference of only ∼1% in the absolute flux between the EPIC-pn and MOS cameras, and this is consistent with the latest ESA calibration.
4.1. Absorbed power-law
Because of the Compton scattering interaction between the accretion disk photons and the hot corona, the X-ray spectrum of this source can be modeled as a power-law with slope given by the photon index Γ, which is absorbed by the interstellar medium (ISM) in the Milky Way with a cross-section given by the Tuebingen-Boulder model (Wilms et al. 2000), called TBabs in XSPEC. To compute the ISM column density, we used the nH tool provided by Heasarc, which estimates NH = 3.5 × 1020 cm−2 for 3C 215. The overall model fit, which in XSPEC notation is TBabs*zpowerlw, has an χ2/d.o.f. = 742.83/711, providing a good starting point for the spectral analysis.
4.2. Double absorbed power law
As discussed in Sect. 2, 3C 215 shows a strong jet emission. In order to explore the possible contribution of the jet in the X-ray spectrum, we added another power-law in the overall model, TBabs*(zpowerlw+zpowerlw) in the XSPEC notation. The fit provides two different values for the two photon indices, one soft (Γ1 = 1.97 ± 0.06) and one hard (Γ2 = 1.29 ± 0.15), with χ2/d.o.f. = 729.36/710. Thus, we fixed the jet power-law component to its best-fit value because having two free power-law slopes was causing problems when performing spectral fitting, as the fit routine was often switching between the two slopes. While the first power-law is consistent with the one expected from inverse Compton scattering in the disk-corona system, the second one is similar to the one observable in flat spectrum radio quasars (FSRQs) that, conversely, are dominated by the jet. The presence of both coronal and jet emission can be expected in the class of broad-line radio galaxies, given their intermediate inclination (Grandi et al. 2006; Kataoka et al. 2011; Tazaki et al. 2013; Bostrom et al. 2014). Nonetheless, the jet component is subdominant, with a luminosity of ≲25% for the corona in the 0.5−10 keV spectrum, with luminosities (in cgs units) of  and
and  smaller than the one related to the corona emission, namely,
  and
and  . The significant improvement of the χ2 with respect to the single power-law model (Δχ2 = 13.47 with one d.o.f. less, corresponding to Pjet = 99.97%), leads us to include the presence of the jet emission in the X-ray spectrum of 3C 215.
4.3. Modeling the emission and absorption features
In the ratio plot in Fig. 3, there are hints of an emission line at ∼6.5 keV, likely associated with Fe K emission line and a possible absorption feature at ∼9 keV. We modeled these emission and absorption features using Gaussian profiles in the source rest frame, in XSPEC zgauss, with width σg and peak energy Eg. For the emission line, the fit of the overall model, that in XSPEC notation is TBabs*(zgauss+zpowerlw+zpowerlw), provided the parameter values 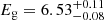 keV, σg < 0.41 keV, photon indices, Γ1 = 1.95 ± 0.06 and Γ2 = 1.29, and equivalent width, EW
 eV, the latter obtained with the XSPEC command eqwidth (see Fig. 4). Using the Fisher test we derive a confidence level of Pem = 98.7% for the detection of the emission line. This model provides χ2/d.o.f. = 720.52/707. We carried out the same analysis also for the possible absorption line with fixed width, showing χ2/d.o.f. = 716.19/705, while the relative Fisher test provided a probability of Pabs = 89%, which led us to discard the presence of this absorption feature on statistical grounds. The best-fit values of the parameters are shown in Table 1.
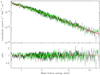 |
Fig. 3. X-ray spectrum (upper panel) and data to model ratio (lower panel), using the XSPEC notation, TBabs*(zpowerlw+zpowerlw) for pn and MOS data (in black and green, respectively). Model is shown with the red line. |
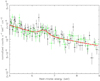 |
Fig. 4. Zoomed pn and MOS data (in black and green, respectively) and model (in red) in the 5−9 keV band including a Gaussian emission line at E ≃ 6.53 keV in the model TBabs*(zgauss+zpowerlw+zpowerlw), using XSPEC notation. |
Best fit-value of the parameters for the model TBabs*(zgauss+zpowerlw+zpowerlw).
4.4. Reflection from ionized material
The peak energy, E > 6.4 keV, of the iron emission line suggests that the reflector is made by different ionized iron species, and this phenomenon can be interpreted as a reflection from ionized gas in the accretion disk. To account for this process, we used the additive model xillver (García et al. 2013), which can describe the reflected spectrum of the radiation that is reprocessed in an ionized accretion disk, requiring that the incident flux is generated by a power-law spectrum, as in the case of the Comptonized emission from an hot corona in the AGN environment.
In this model, the ionization parameter, ξ = Lion/nr2, is introduced, where Lion is the luminosity of the incident ionizing radiation in the energy range of E = 13.6 eV−13.6 keV, while n and r are the density of the reflector and its distance from the ionizing source, respectively. This model is also dependent on the inclination angle of the line of sight, i. We kept this value fixed at i = 30°, which is a typical value for a BLRG, since the fit is unable to be constrained it if it is set free to vary.
In addition, we used a Gaussian smoothing profile with an energy-independent width, in XSPEC gsmooth, in order to consider the possibility of velocity broadening of the line in addition to the observed broadening due to the presence of emission from a range of iron ions. The overall model fit, in XSPEC TBabs*(zpowerlw+gsmooth*xillver), provides a width upper limit of σion < 82 eV, ionization of  , and corona photon index of
  . The value χ2/d.o.f. = 728.75/709 is comparable with that of the double power law model.
4.5. The relxill model
We find an excess of width of the emission line when considering both phenomenological and xillver models, with a relatively large FWHM of ∼10 000 km s−1, which would suggest a location relatively close to the SMBH. Here, we test the hypothesis that the width of the line is due to relativistic effects from reflection onto accretion disk using the model relxill (García et al. 2014; Dauser et al. 2014), which takes into account the special and general relativity effects shaping the reflected emission line profile. This model introduces new parameters, namely, the dimensionless spin parameter, a = Jc/GM2 (kept fixed at the maximum value a = 0.998), the distance between the inner radius of the reflector and the SMBH, Rin, the distance of the outer radius, Rout (kept fixed at the standard value Rout = 103 Rg), and the reflection fraction, Rf, namely, the ratio between the reflected and direct emission. The best-fit values relative to this model, in XSPEC nomenclature TBabs*(zpowerlw+relxill), are Γ1 = 1.93 ± 0.02,  , Rin > 38 Rg, Rf = 0.09 ± 0.04 with χ2/d.o.f. = 722.47/708, showing an improvement of Δχ2 = 6.28 with 1 d.o.f. less and confidence level Prelxill = 98% with respect to the xillver model. The best-fit value of the parameters are shown in Table 2. We decided to choose TBabs*(zpowerlw+relxill) as our best-fit model, as it performs well in characterizing the X-ray spectrum of 3C 215.
Best fit-value of the parameters for the model TBabs*(zpowerlw+relxill).
4.6. Neutral reflection from cold material
Despite establishing the best-fit model for the spectrum of 3C 215 in Sect. 4.5, we tested an additional model component in order to verify the presence or absence of neutral Compton reflection from a distant, cold, and optically thick material (such as the putative AGN torus). We used the model pexmon (Nandra et al. 2007). We added this model as a new component to the best-fit model shown in Table 2. Since we are interested in the neutral Fe Kα (E = 6.4 keV) equivalent width, we freeze all the parameters, except for Rpex, in order to derive limits on the presence of neutral reflection. We obtained a value Rpex ≃ 0 for the neutral reflection fraction. We also computed the Fe Kα EW modeling the line with a Gaussian profile, fixing the energy peak E = 6.4 keV and line width σ = 0 and adding this new component to the ionized iron emission line model. We obtained an upper limit EWKα < 26 eV. In order to explore the jet effect on this estimate, we performed the same calculation eliminating data and the second power-law in the model (the one describing the jet emission) and we found that EWKα < 41 eV. The upper limit is computed by fixing the line intensity with its best-fit value plus the associated intensity error. This is an indication of an absent or weak neutral reflection features, whose implications for the putative AGN torus and SMBH feeding is discussed in Sect. 5.
5. Results and discussion
The best-fit model we found in the spectral analysis in Sect. 4 describes the X-ray spectrum of 3C 215 as an absorbed double power-law with a tentative detection of an iron emission line peaking at E ∼ 6.53 keV. The shape and ionization of the emission line is affected by the interaction with an ionized reflector and relativistic blurring, and both are taken into account in the model.
We computed the ionizing continuum luminosity, Lion ≃ 1.38 × 1045 erg s−1, modeling the ionizing spectrum as a single power-law between E = 13.6 eV−13.6 keV, without the contribution of the jet and using the XSPEC command clumin. We also calculated the X-ray luminosity, LX = (5.49 ± 0.13)×1044 erg s−1, defined as the spectrum luminosity in an energy range between E = 2−10 keV and considering both the contributions of the corona and the jet.
Previous observation of this source in the optical/UV band provided an estimate of the central SMBH mass log(MBH/M⊙) = 8.92 ± 0.5 (Tang et al. 2012). From this value, we are able to estimate the Eddington luminosity LEdd = 1.3 × 1038 MBH/M⊙ erg s−1 and the gravitational radius Rg = GMBH/c2, which will be used as an unit of measure for distances in the nuclear region on this AGN. Their values in log scale and cgs units are log LEdd = 47.03 ± 0.5 and log Rg = 14.9 ± 0.5, respectively. By merging the information obtained from our analysis with the data presented in the literature, it is possible to derive a more detailed description of this AGN and of its nuclear environment.
5.1. Jet contribution in the X-ray spectrum
The 0.5−10 keV spectrum of 3C 215 shows a jet contribution in the form of a flat power law (Γ ∼ 1.29) together with a second steep power law (Γ ∼ 1.95) likely associated with the Inverse Compton emission originated in the corona. As discussed in the previous section, the contribution of the jet power law to the overall X-ray spectrum is subdominant with respect to the corona emission (Ljet ≲ 25%), in accordance with other BLRG observations (Grandi & Palumbo 2007). This result is also in agreement with 3C 215 mixing parameter estimate η ≃ 0.034 (Kataoka et al. 2011), computed through SED fitting and defined as the ratio between non-thermal and thermal emission.
The jet component seems to connect this source to blazars, in particular to FSRQs, which have harder photon indices in the X-ray band on average, as compared to the blazar class overall (Sambruna et al. 1994; Comastri et al. 1997; Sambruna 1997; Fan et al. 2012). Moreover, the observed optical broad emission lines (Tang et al. 2012), the high luminosity and flat radio spectrum (shown in 3C 215 SED reported in the NASA/IPAC Extragalactic Database) further corroborates this hypothesis.
The joint observation of a steep Seyfert-like spectrum and a FSRQ spectrum in the X-ray band leads us to assume an intermediate inclination angle for this source, as expected for BLRGs. Nonetheless, these particular sources strongly challenge the bounds of the unified model, since there are observations of BLRGs with a visible jet contribution (e.g. Bostrom et al. 2014), while other BLRGs do not exhibit the jet component in the X-ray band (e.g. Ronchini et al. 2019), leading to assume that also in the BLRG class there exist other sub-classes with different observative features that may not be explained only by different observational angles, since it is still unclear at which inclination angle a BLRG stops being “blazar-like” and starts to be more “Seyfert-like”.
5.2. Ionized reflector
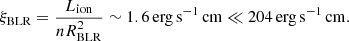
Our data analysis of 3C 215 shows that the reflector, which interacts with the ionizing primary radiation from the hot corona, is placed at distance Rin ≳ 38 Rg from the SMBH, which is relatively far compared to the ISCO value of Rin ∼ 1 Rg expected for an AGN with a SMBH spin of a ∼ 1. It is also ionized, with an ionization parameter 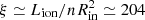 erg s−1 cm. Inverting the relation, we can obtain an upper limit for the reflector particle density n ≲ 1010 cm−3.
The density estimated in this calculation is low for an internal region of the accretion disk, whose density is expected to be of the order of ∼1015 cm−3. The density of the reflector seems to be more in agreement with the BLR, with a typical density of ∼1010 cm−3, or with an outer ionized layer of the accretion disk.
In previous observations in the optical/UV band of 3C 215, there were hints of a stratified BLR with a disk-like geometry for the region producing the CIV emission line (Labita et al. 2006). Tang et al. (2012) provided the FWHM of some broad optical emission lines of this source, such as CIV and Hβ, with values 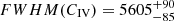 km s−1 and
 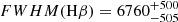 km s−1, respectively.
We observe that the FWHM(Hβ) value is slightly larger than the CIV one. From standard BLR stratification models, we would expect the opposite, with the more ionized line produced more internally, hence, with an higher FWHM, related to the velocity dispersion. This evidence can be explained considering that, since the line of sight is tilted with respect to the equatorial plane, we probably observe an Hβ outflowing source, which has a higher velocity dispersion along the line of sight, hence, a higher FWHM, even if the source projected on the equatorial plane is more external than the CIV one, which, in contrast, has a disk-like geometry.
Considering the reverberation mapping relation RBLR = GMBH/FWHM2, the disk-like portion of the BLR can cover the accretion disk surface at distances of ≳102 Rg thus contributing to the reflection phenomenon that generates the reflected spectrum of 3C 215 in the X-ray band. For distances of R ≲ 38 Rg the ionizing flux from the hot corona can fully ionize elements lighter than iron, thereby excluding emission lines in the optical/UV band. This may, at least partially, explain why there is no presence of observable reflection features in the SMBH neighborhood. At the distance of RBLR, where the bulk reflection from the BLR is taking place, we expect a reflector less ionized with respect to the reflection in the inner portion of the disk, where 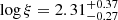 erg s−1 cm. From the calculations, considering n ∼ 1010 cm−3 and RBLR ∼ 4 × 10² Rg, calculated as the mean value of the two emission lines, we obtain:
 (1)
(1)
This evidence suggests a standard optically thick and geometrically thin structure in the outer part of the accretion disk of 3C 215, while the inner part could be a truncated disk or a composite disk, whose inner part is, in turn, radiatively inefficient; namely, it is in an ADAF-like state or, alternatively, a puffed-up slim disk.
5.3. Long-term time variability of the X-ray spectrum
In order to better describe this AGN, it is important to compute the Eddington parameter, λ = Lbol/LEdd, where Lbol is the bolometric luminosity. We were able to estimate Lbol starting from LX through the bolometric correction KX = Lbol/LX parametric equation derived by Duras et al. (2020). Using this procedure we computed the Eddington parameter λ for our observation and for the previous X-ray observations of 3C 215 in the energy band of E = 0.5−10 keV, carried out by R&T00 and H06. Using observations of different satellites, these authors managed to estimate the X-ray luminosity LX. The results are summarized in Table 3.
Information and parameter values concerning the observations of 3C 215 in Reeves & Turner (2000, R&T00), in Hardcastle et al. (2006, H06) and in our spectral analysis.
Comparing these multi-epoch estimates, we observed variability of the X-ray spectrum on time-scales of around eight years. Namely, LX decreases, producing a recent spectrum dimmer with respect to the one observed ∼17 years before our observation. Evidences of this kind of variability in the X-ray spectrum of AGNs were already found in Seyfert 1 galaxies (Noda et al. 2014, 2016), with timescales from weeks to years. There is no evidence of a jet contribution in the long-term variability of this source, both because it is not dominant in the X-ray band and because past observations were not precise enough to evidence this feature.
This phenomenon can be attributed to a change of the accretion rate (Noda et al. 2014). An efficiently accreting SMBH is very luminous and forms an optically thick and geometrically thin disk up to the ISCO and a subdominant, if present, internal ADAF state. If the accretion rate and, consequently, the luminosity decrease, as in this case, the ADAF state is no more subdominant in the internal region, the disk emissivity drops and the dominance of the hot corona in the overall X-ray emission produces an harder spectrum. Based on the same principle, Noda & Done (2018) explain the changing-look phenomenon of the source Mrk 1018, which, across a time span of ∼8 yr switches from a Seyfert 1 galaxy to a Seyfert 2. They state that the variation in the accretion rate is driven mainly by two combined factors, previously observed in BH binary systems: 1. The evaporation or condensation of the inner disk in an advection-dominated hot flow causing a respective decrease or increase in the luminosity by a factor of ∼2−4; and 2. Thermal front propagation due to the H-ionization instability in the disk.
In the case of 3C 215, we observe a variability of almost a factor of ∼3 from 1995 to 2012, which is more comparable to the classic X-ray variability of AGNs rather than a changing-look phenomenon, where luminosity drops by at least an order of magnitude. Therefore, the observational evidences of 3C 215 suggest an evolution of the inner structure of the AGN, consistent with the luminosity drop caused by the evaporation of the inner thin disk, as proposed by Noda & Done (2018). However, we must note that the Eddington parameter estimated through our analysis is not completely in agreement with the values expected by this scenario, which is expected to be λ ∼ 1%. This leads us to believe that, with respect to the other sources, the contribution of the standard outer disk in 3C 215 is more relevant, questioning the presence and the importance of the ADAF in the inner disk.
5.4. Lack of neutral absorption and reflection from the torus
We want to underline the role of the putative obscuring torus that surrounds the nuclear regions of 3C 215. It is typically made by optically thick material that interacts with the X-ray emission from the nuclear region through absorption and Compton scattering, giving important information about its geometry. Because of its distance from the SMBH, typically of ∼pc scale, it is too cold to be ionized, hence we test its presence analyzing the neutral reflection component of the spectrum. From the data analysis, we find an upper limit for the equivalent width of the neutral Fe Kα line without jet contribution, namely, EWKα ≲ 41 eV, indicating a weak interaction between the primary X-ray radiation and the torus, which gives a minimal contribution to the overall X-ray spectrum. Theoretical models associated to such a weak or absent iron line feature a disrupted and inefficient obscurer with a patchy geometry, low column density NH (with an upper limit NH < 5 × 1022 cm−2) (Ikeda et al. 2009; Murphy & Yaqoob 2009), and poor presence of dust (Gohil & Ballantyne 2015). This hypothesis is also supported by the value of the reflection parameter Rpex ≃ 0 obtained in the spectral analysis, describing a torus which covers only a small fraction of the space surrounding the AGN. Obscuring material can represent the main matter reservoir for accreting SMBHs, triggering feedback through nuclear outflows or jet emission, as in the case of RL AGNs. For high Eddington parameters, logλ > −1.5 (as in 3C 215), the covering fraction of the torus is small (∼40%) because a large fraction of that material was and maybe it is still being accreted by the central SMBH, bringing it to high luminosity values (Ricci et al. 2017). Seyfert 1 galaxies show a similar obscuration but absence of jet emission, possibly substituted by nuclear outflows, producing Fe Kα EW of the order of ∼53 eV (Shu et al. 2010).
The characteristics described in this scenario may appear to be in disagreement with what was observed in the IR band of 3C 215 from Runnoe et al. (2013). These authors found a covering fraction related to the MIR radiation c = 64%, which is very large considering that the torus does not show significant presence of dust, which would permit the interaction between the torus and the IR flux. An interpretation of this discrepancy could be the presence of a second obscuring component, such as a polar dusty outflow that is luminous in the IR band (Hönig et al. 2012; Ramos Almeida & Ricci 2017). Such a wind could account for the large covering factor estimated by previous studies. Nonetheless, it does not contradict our results regarding the obscuring torus obtained with our X-ray analysis.
5.5. The possibility of a slim disk
As discussed in Sect. 5.2, the lack of reflection features in the internal region of this radio-loud quasar may possibly stand in agreement with a double-state of the accretion disk, where the outer portion shows a standard Shakura-Sunyaev geometry (Shakura & Sunyaev 1973), while the internal one (Rin ≲ 38 Rg) is radiatively inefficient and geometrically thick, favoring the production of a jet. Nonetheless, ADAF states are present only in the disk of low accreting SMBHs. If the Eddington parameter is high (λ ≳ 0.3) the disk becomes thick enough to make advection an efficient cooling mechanism, hence leading to a drop of the disk emissivity. This disk state, related to highly accreting SMBHs, is called a slim disk (Abramowicz et al. 1988; Abramowicz & Fragile 2013; Yuan & Narayan 2014); within the uncertainties, it is in agreement with the Eddington parameter estimated here:  .
.
According to this scenario, the presence of a composite accretion disk leads to an anisotropic radiation field that interacts differently with the various components. Consequently, a self-shadowing phenomenon can produce two dynamically distinct zones of the BLR, with one of them possibly composed by Hβ outflowing clouds (Wang et al. 2014), which is in agreement with the previous BLR discussion of 3C 215. The higher the accretion rate, the greater is the self-shadowing effect, hence, we do not expect it to be very intense in this source since it is usually related to super-Eddington SMBHs.
In relation to this local disk emissivity drop, we could expect also a drop of the interaction between the UV incident flux and the torus, leading to a decrease of the reprocessed IR flux and to a torus characterization bias, since it would appear as an inefficient obscurer. Nonetheless, these features are also observed in the X-ray band of 3C 215, hence, they are not due to only the self-shadowing bias. In addition, to account for the intense IR emission of this source we proposed the presence of a second dusty component. In this scenario, this reprocessing component could be constituted by an outflowing BLR that is possibly dust-rich (Czerny & Hryniewicz 2011; Baskin & Laor 2018).
Although this scenario is able to describe several observational features of 3C 215, it does not provide an explanation of the particular geometry of the jet emission observed in this source, noting the necessity of a possible new scenario, discussed in the next section.
5.6. The possibility of a SMBH binary system
A third speculative scenario that sets out to explain our X-ray and previous multi-wavelength observations of 3C 215 involves the presence of a second SMBH that forms a SMBH binary system (SMBHB; Begelman et al. 1980; De Rosa et al. 2019). Various motivations led us to consider the possibility of a SMBHB in describing this source, such as hints of a previous major merger event involving the 3C 215 host galaxy (as we discussed in Sect. 2), the twisted and knotted radio jet emission in this AGN that is possibly due to the formation of warped accretion disks (Bardeen & Petterson 1975; Papaloizou & Pringle 1983; Nayakshin 2005; Ulubay-Siddiki et al. 2009), or a direct interaction of the binary with the jet-producing region (Lawrence & Elvis 2010; Tremaine & Davis 2014) that leads to the perturbed shape of the obscuring torus and the relatively high accretion rate of this source. All these features can be explained by the presence of a putative secondary SMBH that perturbs the space surrounding its orbit. If the distance between the two SMBHs was at sub-pc scales, this can possibly also explain the lack of material, hence, the reflection features in the internal portion of the accretion disk at distances of ≲38 Rg, as observed in the X-ray analysis.
Nonetheless, SMBHBs are very elusive and hard to recognize since they can not be spatially resolved, such that a large fraction of binary system detection has been serendipitous. The state-of-the-art methods to select these systems are multi-epoch spectroscopic observations, multi-band follow-ups, and cross-correlation analyses, which have been able to show some signatures of the periodic motion of the binary. Therefore, the current data available on 3C 215 are not enough to firmly select it as a strong SMBHB candidate. Nonetheless, there are two main SMBHBs selection methods that rely only on single-epoch spectroscopic observations of broad emission lines (BELs) in the optical/UV band.
The first method consists of detecting periodical and intense Doppler shift Δv of BEL peaks produced in the BLR, linked to the internal orbital motion in the same way spectroscopic binary stars are observed (Bogdanović et al. 2008; Eracleous et al. 2012; Decarli et al. 2013). Here, Δv can be computed by the difference between MgII and [OIII] peak velocities, the latter having a good approximation of the same velocity of the host galaxy (Ju et al. 2013; Wang et al. 2017). For 3C 215, the estimate of Δv ≃ 915 km s−1 (Tang et al. 2012) is very high compared to the usual values (e.g. Wang et al. 2017) and close to the selection threshold |Δv|≳1000 km s−1.
The second method is based on the fact that during binary orbital decay, the BLR starts to emerge from the Roche lobes of the binary, producing outflows of material and consequently the BLR erosion. Since this process affects the external region of the BLR more significantly, we could expect for low-ionization emission lines to suffer a significant flux decrease with respect to the high-ionization ones, which are produced more internally. Interestingly, the BLR erosion is consistent with the hypothesis of an outflowing external portion of the BLR proposed in Sect. 5.2. Montuori et al. (2011, 2012) found that the ratio between the fluxes of the CIV line (FCIV) and of the MgII line (FMgII) increases with an increasing orbital period, P, hence, this ratio constitutes a good binary diagnostic.
The selection of SMBH binary candidates sources is based on their satisfying the relation FMgII/FCIV ≲ 0.1, with a threshold that is smaller with respect to the common value, which is FMgII/FCIV ∼ 0.3−0.4. 3C 215 shows a flux ratio of FMgII/FCIV = 0.14 ± 0.04, which is consistent with the selection requirement. However, these two analyses can only select 3C 215 as a potential weak SMBHB candidate, given that they are not able to provide clear and unequivocal evidence of the presence of the binary through the detection of orbital modulations.
6. Conclusions
We performed the most accurate X-ray spectral analysis of the broad line radio galaxy 3C 215 using high quality data from the XMM-Newton satellite. Thanks to a comparison of the results we obtained with multi-wavelength observations from the literature, we were able to characterize the innermost components of this AGN, modeling their geometry and mutual interactions.
This source shows a jet contribution in the X-ray band that can be described as a flat power law, very similarly to FSRQs. The primary X-ray continuum from the corona interacts with a reflector placed at relatively large distances (R ≳ 38 Rg) from the SMBH. Evidence suggests that the reflection component is the accretion disk, which is ionized (logξ ≃ 2.31 erg s−1 cm), and also part of the BLR, which shows a stratified structure, with the CIV emission line emitter exhibiting a disk-like geometry over the accretion flow and a putative outflowing Hβ source region. The ionized disk gas falls in towards the SMBH, which accretes its mass with an high sub-Eddington rate ( ).
).
Spectral features expected from the putative obscuring torus are very weak, if not altogether absent, and this suggests a patchy geometry with a low covering fraction (∼40%) and reflection parameter (Rpex ≃ 0). The low Fe Kα equivalent width (EW < 41 eV) suggests a minimal fraction of dust in the X-ray torus structure, in contrast with previous observations in the literature that reported a covering fraction c = 64% in the MIR band directly linked with a dusty obscurer. This can be explained by the presence of an internal polar dusty wind that contributes, together with the torus, in the nuclear obscuration process.
We compared the results of multiple spectral analyses carried out in different years and, thus, observed an intense variability on the part of the X-ray spectrum of 3C 215, which is becoming fainter (by almost a factor of 4) with an overall time step of ∼17 years. This variability can be associated with a drop in the Eddington parameter that leads to the evaporation of the inner edge of the accretion disk in a radiatively inefficient geometrically thick accretion flow.
We propose three scenarios that could explain these observed properties:
-
An ADAF state in the internal region, which is in accordance with the reflector distance, but not with the accretion rate, as it would be too high for this type of structure.
-
A slim inner disk, which has a similar geometrical structure to that of the ADAF and is consistent with the 3C 215 accretion regime. It accounts for almost all the observed features, except for the unusual jet emission shape.
-
A SMBH binary system, which may describe the overall structure of 3C 215 in a good way, but is still lacking in terms of a firm SMBHB detection, making this scenario particularly speculative.
Some observational features manifested by 3C 215 are common in RL sources, such as weak reflection features (e.g. Bostrom et al. 2014; Ursini et al. 2018b; Ronchini et al. 2019; Chalise et al. 2020). In contrast, RQ AGNs show an opposite behavior, with a standard accretion disk that extends down to the ISCO, and which is able to produce strong reflection features such as the Fe Kα line and provide good spin parameter estimates (Fabian et al. 2014; Reynolds 2020).
Nonetheless, 3C 215 shows an obscuring torus that is not very different from those in RQ AGNs (Shu et al. 2010; Tazaki et al. 2013; Panessa et al. 2016) and its accretion rate λ is high compared to other RL AGNs, as well as being more similar to the one expected in RQ sources. In fact, as we discussed in Sect. 5.4, these two characteristics are strongly linked. However, the accretion disk geometry, which depends on the accretion rate, must be thick enough to allow matter collimation and jet production (Ballantyne 2007). As we discussed, this peculiar geometry can be obtained both with high and low accretion rates, thus suggesting that the most significant phenomenon helping jet production could possibly be the disk height (Abramowicz & Fragile 2013) or the mutual rotation direction between the SMBH and the accreting material (Garofalo 2019), rather than the accretion rate itself.
This observation allows us to add this contribution to the BLRG catalog and, via the hints of jet emission in the X-ray band, allows us to better understand how heterogeneous these sources are, at least in the X-ray band. Discovering how and why BLRGs show different observational features can be crucial in solving the RL-RQ dichotomy. Unfortunately, with the data obtained through our observations and the previous ones from the literature, we can achieve only a weak SMBHB candidate selection, although the selection tests we made for 3C 215 are promising. New multi-epoch spectroscopic observations, multi-band follow-ups, and cross-correlation studies are required in order to firmly determine 3C 215 as a strong SMBH candidate and to possibly add this source in the new developing SMBHB catalogs, which could then be compared with those related to classical single AGNs. In particular, with new observations in the radio band, for example, with the SKA facility, it will be possible to resolve the jet source of 3C 215 with high resolution, thereby acquiring new information about the process that bends its jet. Also, subsequent time monitoring in the optical/UV band with the HST could provide hints of some kind of time variability in the emission lines, possibly associated with orbital periods of a putative binary system. Finally, an X-ray follow-up can further monitor the X-ray variability observed in this source, providing additional validation for the SMBHB scenario.
Acknowledgments
AM and FT thank the anonymous referee for the constructive comments. This work was performed by AM for his Master Thesis in Physics – Curriculum Astrophysics at the Tor Vergata University of Rome based on observations obtained with XMM-Newton, an ESA science mission with instruments and contributions directly funded by ESA Member States and NASA. AM and FT thank F. Vagnetti, F. Panessa and G. Bruni for the useful discussions.
References
- Abramowicz, M. A., Czerny, B., Lasota, J. P., & Szuszkiewicz, E. 1988, ApJ, 332, 646 [Google Scholar]
- Abramowicz, M. A., & Fragile, P. C. 2013, Liv. Rev. Rel., 16, 1 [Google Scholar]
- Ballantyne, D. R. 2007, Mod. Phys. Lett. A, 22, 2397 [NASA ADS] [CrossRef] [Google Scholar]
- Ballantyne, D. R., Ross, R. R., & Fabian, A. C. 2002, MNRAS, 332, L45 [NASA ADS] [CrossRef] [Google Scholar]
- Ballantyne, D. R., Bollenbacher, J. M., Brenneman, L. W., et al. 2014, ApJ, 794, 62 [NASA ADS] [CrossRef] [Google Scholar]
- Bardeen, J. M., & Petterson, J. A. 1975, ApJ, 195, L65 [NASA ADS] [CrossRef] [Google Scholar]
- Baskin, A., & Laor, A. 2018, MNRAS, 474, 1970 [Google Scholar]
- Begelman, M. C., Blandford, R. D., & Rees, M. J. 1980, Nature, 287, 307 [Google Scholar]
- Bettoni, D., Falomo, R., Fasano, G., & Govoni, F. 2003, A&A, 399, 869 [NASA ADS] [CrossRef] [EDP Sciences] [Google Scholar]
- Blandford, R. D., & Znajek, R. L. 1977, MNRAS, 179, 433 [NASA ADS] [CrossRef] [Google Scholar]
- Bogdanović, T., Smith, B. D., Sigurdsson, S., & Eracleous, M. 2008, ApJS, 174, 455 [NASA ADS] [CrossRef] [Google Scholar]
- Bostrom, A., Reynolds, C. S., & Tombesi, F. 2014, ApJ, 791, 119 [NASA ADS] [CrossRef] [Google Scholar]
- Bridle, A. H., Hough, D. H., Lonsdale, C. J., Burns, J. O., & Laing, R. A. 1994, AJ, 108, 766 [NASA ADS] [CrossRef] [Google Scholar]
- Chalise, S., Lohfink, A. M., Kara, E., & Fabian, A. C. 2020, ApJ, 897, 47 [NASA ADS] [CrossRef] [Google Scholar]
- Chiaberge, M., & Marconi, A. 2011, MNRAS, 416, 917 [Google Scholar]
- Chiaberge, M., Gilli, R., Lotz, J. M., & Norman, C. 2015, ApJ, 806, 147 [NASA ADS] [CrossRef] [Google Scholar]
- Comastri, A., Fossati, G., Ghisellini, G., & Molendi, S. 1997, ApJ, 480, 534 [NASA ADS] [CrossRef] [Google Scholar]
- Czerny, B., & Hryniewicz, K. 2011, A&A, 525, L8 [NASA ADS] [CrossRef] [EDP Sciences] [Google Scholar]
- Dauser, T., Garcia, J., Parker, M. L., Fabian, A. C., & Wilms, J. 2014, MNRAS, 444, L100 [NASA ADS] [CrossRef] [Google Scholar]
- Dauser, T., García, J., Walton, D. J., et al. 2016, A&A, 590, A76 [NASA ADS] [CrossRef] [EDP Sciences] [Google Scholar]
- De Rosa, A., Vignali, C., Bogdanović, T., et al. 2019, New Astron. Rev., 86, 101525 [Google Scholar]
- Decarli, R., Labita, M., Treves, A., & Falomo, R. 2008, MNRAS, 387, 1237 [NASA ADS] [CrossRef] [Google Scholar]
- Decarli, R., Falomo, R., Treves, A., et al. 2010, MNRAS, 402, 2441 [NASA ADS] [CrossRef] [Google Scholar]
- Decarli, R., Dotti, M., Fumagalli, M., et al. 2013, MNRAS, 433, 1492 [Google Scholar]
- Duras, F., Bongiorno, A., Ricci, F., et al. 2020, A&A, 636, A73 [CrossRef] [EDP Sciences] [Google Scholar]
- Eracleous, M., Sambruna, R., & Mushotzky, R. F. 2000, ApJ, 537, 654 [NASA ADS] [CrossRef] [Google Scholar]
- Eracleous, M., Boroson, T. A., Halpern, J. P., & Liu, J. 2012, ApJS, 201, 23 [Google Scholar]
- Fabian, A. C., Parker, M. L., Wilkins, D. R., et al. 2014, MNRAS, 439, 2307 [NASA ADS] [CrossRef] [Google Scholar]
- Fan, J. H., Yang, J. H., Yuan, Y. H., Wang, J., & Gao, Y. 2012, ApJ, 761, 125 [NASA ADS] [CrossRef] [Google Scholar]
- Fernini, I. 2007, AJ, 134, 158 [NASA ADS] [CrossRef] [Google Scholar]
- Floyd, D. J. E., Kukula, M. J., Dunlop, J. S., et al. 2004, MNRAS, 355, 196 [NASA ADS] [CrossRef] [Google Scholar]
- García, J., Dauser, T., Reynolds, C. S., et al. 2013, ApJ, 768, 146 [NASA ADS] [CrossRef] [Google Scholar]
- García, J., Dauser, T., Lohfink, A., et al. 2014, ApJ, 782, 76 [NASA ADS] [CrossRef] [Google Scholar]
- Garofalo, D. 2019, ApJ, 876, L20 [Google Scholar]
- Garofalo, D., Evans, D. A., & Sambruna, R. M. 2010, MNRAS, 406, 975 [NASA ADS] [Google Scholar]
- Garofalo, D., Kim, M. I., & Christian, D. J. 2014, MNRAS, 442, 3097 [NASA ADS] [CrossRef] [Google Scholar]
- Gilbert, G. M., Riley, J. M., Hardcastle, M. J., et al. 2004, MNRAS, 351, 845 [NASA ADS] [CrossRef] [Google Scholar]
- Gohil, R., & Ballantyne, D. R. 2015, MNRAS, 449, 1449 [NASA ADS] [CrossRef] [Google Scholar]
- Grandi, P., & Palumbo, G. G. C. 2007, ApJ, 659, 235 [NASA ADS] [CrossRef] [Google Scholar]
- Grandi, P., Malaguti, G., & Fiocchi, M. 2006, ApJ, 642, 113 [NASA ADS] [CrossRef] [Google Scholar]
- Hardcastle, M. J., Evans, D. A., & Croston, J. H. 2006, MNRAS, 370, 1893 [NASA ADS] [CrossRef] [Google Scholar]
- Hönig, S. F., Kishimoto, M., Antonucci, R., et al. 2012, ApJ, 755, 149 [NASA ADS] [CrossRef] [Google Scholar]
- Ikeda, S., Awaki, H., & Terashima, Y. 2009, ApJ, 692, 608 [Google Scholar]
- Ju, W., Greene, J. E., Rafikov, R. R., Bickerton, S. J., & Badenes, C. 2013, ApJ, 777, 44 [Google Scholar]
- Kataoka, J., Stawarz, Ł., Takahashi, Y., et al. 2011, ApJ, 740, 29 [NASA ADS] [CrossRef] [Google Scholar]
- Labita, M., Treves, A., Falomo, R., & Uslenghi, M. 2006, MNRAS, 373, 551 [NASA ADS] [CrossRef] [Google Scholar]
- Laor, A. 2000, ApJ, 543, L111 [NASA ADS] [CrossRef] [Google Scholar]
- Lawrence, A., & Elvis, M. 2010, ApJ, 714, 561 [NASA ADS] [CrossRef] [Google Scholar]
- Lehnert, M. D., Miley, G. K., Sparks, W. B., et al. 1999, ApJS, 123, 351 [NASA ADS] [CrossRef] [Google Scholar]
- Lohfink, A. M., Reynolds, C. S., Mushotzky, R., & Nowak, M. 2013, AAS/High Energy Astrophysics Division, 13, 108.11 [NASA ADS] [Google Scholar]
- Márquez, I., Durret, F., & Petitjean, P. 1999, A&AS, 135, 83 [NASA ADS] [CrossRef] [EDP Sciences] [Google Scholar]
- Moderski, R., Sikora, M., & Lasota, J. P. 1998, MNRAS, 301, 142 [NASA ADS] [CrossRef] [Google Scholar]
- Montuori, C., Dotti, M., Colpi, M., Decarli, R., & Haardt, F. 2011, MNRAS, 412, 26 [NASA ADS] [CrossRef] [Google Scholar]
- Montuori, C., Dotti, M., Haardt, F., Colpi, M., & Decarli, R. 2012, MNRAS, 425, 1633 [NASA ADS] [CrossRef] [Google Scholar]
- Murphy, K. D., & Yaqoob, T. 2009, MNRAS, 397, 1549 [NASA ADS] [CrossRef] [Google Scholar]
- Nandra, K., O’Neill, P. M., George, I. M., & Reeves, J. N. 2007, MNRAS, 382, 194 [NASA ADS] [CrossRef] [Google Scholar]
- Narayan, R., & Yi, I. 1994, ApJ, 428, L13 [NASA ADS] [CrossRef] [Google Scholar]
- Narayan, R., & Yi, I. 1995, ApJ, 444, 231 [NASA ADS] [CrossRef] [Google Scholar]
- Narayan, R., & McClintock, J. E. 2008, New Astron. Rev., 51, 733 [NASA ADS] [CrossRef] [Google Scholar]
- Nayakshin, S. 2005, MNRAS, 359, 545 [NASA ADS] [CrossRef] [Google Scholar]
- Noda, H., & Done, C. 2018, MNRAS, 480, 3898 [NASA ADS] [CrossRef] [Google Scholar]
- Noda, H., Makishima, K., Yamada, S., et al. 2014, ApJ, 794, 2 [NASA ADS] [CrossRef] [Google Scholar]
- Noda, H., Minezaki, T., Watanabe, M., et al. 2016, ApJ, 828, 78 [NASA ADS] [CrossRef] [Google Scholar]
- Padovani, P. 2017, Nat. Astron., 1, 0194 [NASA ADS] [CrossRef] [Google Scholar]
- Padovani, P., Alexander, D. M., Assef, R. J., et al. 2017, A&ARv, 25, 2 [Google Scholar]
- Panessa, F., Barcons, X., Bassani, L., et al. 2007, A&A, 467, 519 [NASA ADS] [CrossRef] [EDP Sciences] [Google Scholar]
- Panessa, F., Bassani, L., Landi, R., et al. 2016, MNRAS, 461, 3153 [NASA ADS] [CrossRef] [Google Scholar]
- Papaloizou, J. C. B., & Pringle, J. E. 1983, MNRAS, 202, 1181 [NASA ADS] [Google Scholar]
- Ramos Almeida, C., & Ricci, C. 2017, Nat. Astron., 1, 679 [Google Scholar]
- Ravindranath, S., Ho, L. C., & Filippenko, A. V. 2002, ApJ, 566, 801 [NASA ADS] [CrossRef] [Google Scholar]
- Reeves, J. N., & Turner, M. J. L. 2000, MNRAS, 316, 234 [NASA ADS] [CrossRef] [Google Scholar]
- Reynolds, C. S. 2020, ARA&A, submitted [arXiv:2011.08948] [Google Scholar]
- Ricci, C., Trakhtenbrot, B., Koss, M. J., et al. 2017, Nature, 549, 488 [NASA ADS] [CrossRef] [Google Scholar]
- Ronchini, S., Tombesi, F., Vagnetti, F., Panessa, F., & Bruni, G. 2019, A&A, 625, A26 [EDP Sciences] [Google Scholar]
- Runnoe, J. C., Shang, Z., & Brotherton, M. S. 2013, MNRAS, 435, 3251 [NASA ADS] [CrossRef] [Google Scholar]
- Sambruna, R. M. 1997, ApJ, 487, 536 [NASA ADS] [CrossRef] [Google Scholar]
- Sambruna, R. M., Barr, P., Giommi, P., et al. 1994, ApJ, 434, 468 [NASA ADS] [CrossRef] [Google Scholar]
- Sambruna, R. M., Eracleous, M., & Mushotzky, R. F. 1999, ApJ, 526, 60 [NASA ADS] [CrossRef] [Google Scholar]
- Shakura, N. I., & Sunyaev, R. A. 1973, A&A, 24, 337 [NASA ADS] [Google Scholar]
- Shu, X. W., Yaqoob, T., & Wang, J. X. 2010, ApJS, 187, 581 [NASA ADS] [CrossRef] [Google Scholar]
- Tang, B., Shang, Z., Gu, Q., Brotherton, M. S., & Runnoe, J. C. 2012, ApJS, 201, 38 [NASA ADS] [CrossRef] [Google Scholar]
- Tazaki, F., Ueda, Y., Terashima, Y., Mushotzky, R. F., & Tombesi, F. 2013, ApJ, 772, 38 [NASA ADS] [CrossRef] [Google Scholar]
- Tremaine, S., & Davis, S. W. 2014, MNRAS, 441, 1408 [NASA ADS] [CrossRef] [Google Scholar]
- Ulubay-Siddiki, A., Gerhard, O., & Arnaboldi, M. 2009, MNRAS, 398, 535 [NASA ADS] [CrossRef] [Google Scholar]
- Urry, C. M., & Padovani, P. 1995, PASP, 107, 803 [NASA ADS] [CrossRef] [Google Scholar]
- Ursini, F., Bassani, L., Panessa, F., et al. 2018a, MNRAS, 481, 4250 [Google Scholar]
- Ursini, F., Bassani, L., Malizia, A., et al. 2018b, https://doi.org/10.5281/zenodo.1472958 [Google Scholar]
- Vestergaard, M., & Osmer, P. S. 2009, ApJ, 699, 800 [Google Scholar]
- Vestergaard, M., & Peterson, B. M. 2006, ApJ, 641, 689 [Google Scholar]
- Wang, J.-M., Qiu, J., Du, P., & Ho, L. C. 2014, ApJ, 797, 65 [NASA ADS] [CrossRef] [Google Scholar]
- Wang, L., Greene, J. E., Ju, W., et al. 2017, ApJ, 834, 129 [Google Scholar]
- Wilms, J., Allen, A., & McCray, R. 2000, ApJ, 542, 914 [Google Scholar]
- Yuan, F., & Narayan, R. 2014, ARA&A, 52, 529 [NASA ADS] [CrossRef] [Google Scholar]
All Tables
Best fit-value of the parameters for the model TBabs*(zgauss+zpowerlw+zpowerlw).
Information and parameter values concerning the observations of 3C 215 in Reeves & Turner (2000, R&T00), in Hardcastle et al. (2006, H06) and in our spectral analysis.
All Figures
|
Fig. 1. VLA A+B image of 3C 215 at 4860 MHz (Bridle et al. 1994). |
| In the text | |
|
Fig. 2. VLA B contour map of 3C 215 at 8.4 GHz (Fernini 2007). |
| In the text | |
|
Fig. 3. X-ray spectrum (upper panel) and data to model ratio (lower panel), using the XSPEC notation, TBabs*(zpowerlw+zpowerlw) for pn and MOS data (in black and green, respectively). Model is shown with the red line. |
| In the text | |
|
Fig. 4. Zoomed pn and MOS data (in black and green, respectively) and model (in red) in the 5−9 keV band including a Gaussian emission line at E ≃ 6.53 keV in the model TBabs*(zgauss+zpowerlw+zpowerlw), using XSPEC notation. |
| In the text | |
Current usage metrics show cumulative count of Article Views (full-text article views including HTML views, PDF and ePub downloads, according to the available data) and Abstracts Views on Vision4Press platform.
Data correspond to usage on the plateform after 2015. The current usage metrics is available 48-96 hours after online publication and is updated daily on week days.
Initial download of the metrics may take a while.