Fig. 5.
Download original image
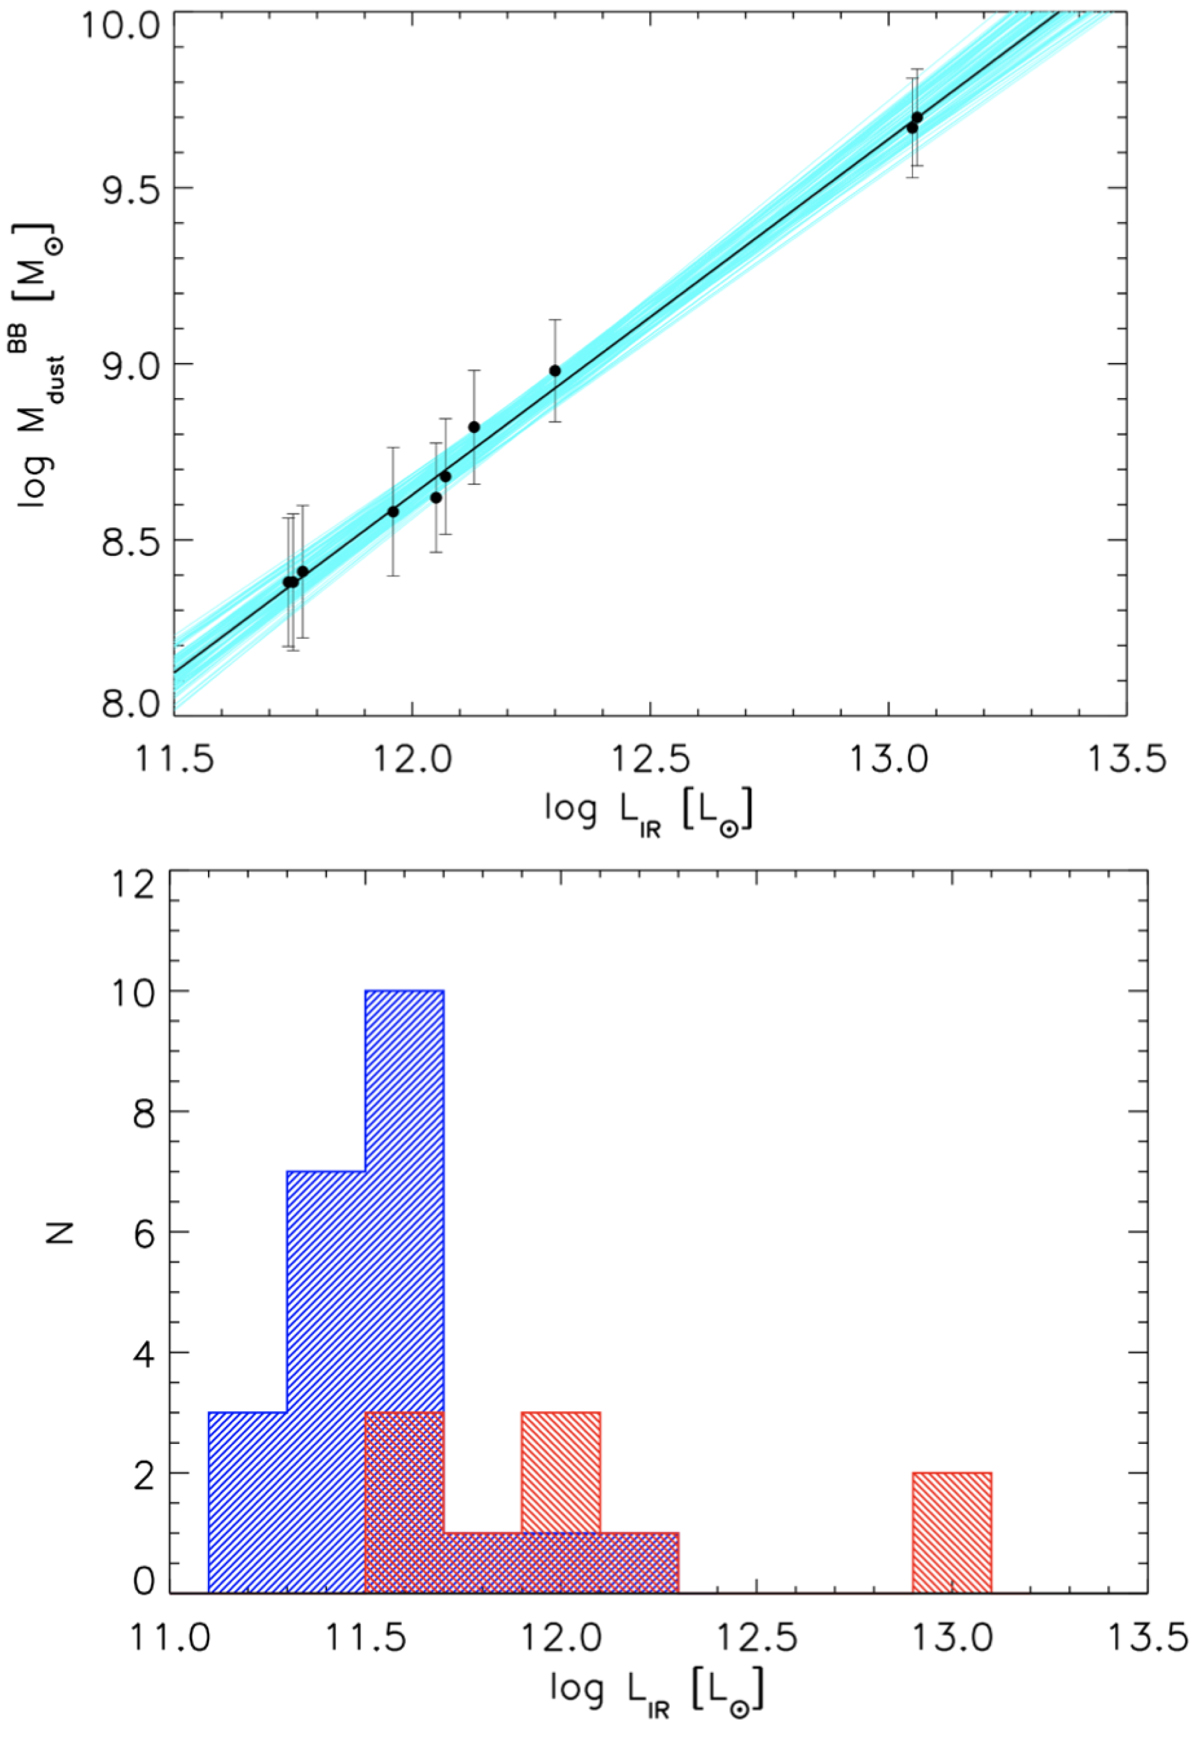
Properties of the non-target serendipitously detected sources. Top: Mdust vs. LIR for the non-target serendipitously detected sources in the ALPINE redshift range (4.1 < z < 5.9). The corresponding Mdust was calculated using the same expression as for the ALPINE targets (Eq. (1)). The Bayesian linear fit is shown by the black and light blue lines, which also illustrate the probability distribution of the fit at 1σ confidence level. The resulting best fit is ![]() (dispersion
(dispersion ![]() dex, Pearson rank coefficient of 0.97, and p-value 10−5). Bottom: distribution of the LIR for the target continuum detected (blue histogram, ⟨log(
dex, Pearson rank coefficient of 0.97, and p-value 10−5). Bottom: distribution of the LIR for the target continuum detected (blue histogram, ⟨log(![]() ) and for the serendipitously detected (red histogram, ⟨log(
) and for the serendipitously detected (red histogram, ⟨log(![]() ) ALPINE sources. LIR valuees were estimated using the stacked SED from ALPINE analogues in the COSMOS field from Béthermin et al. (2020).
) ALPINE sources. LIR valuees were estimated using the stacked SED from ALPINE analogues in the COSMOS field from Béthermin et al. (2020).
Current usage metrics show cumulative count of Article Views (full-text article views including HTML views, PDF and ePub downloads, according to the available data) and Abstracts Views on Vision4Press platform.
Data correspond to usage on the plateform after 2015. The current usage metrics is available 48-96 hours after online publication and is updated daily on week days.
Initial download of the metrics may take a while.