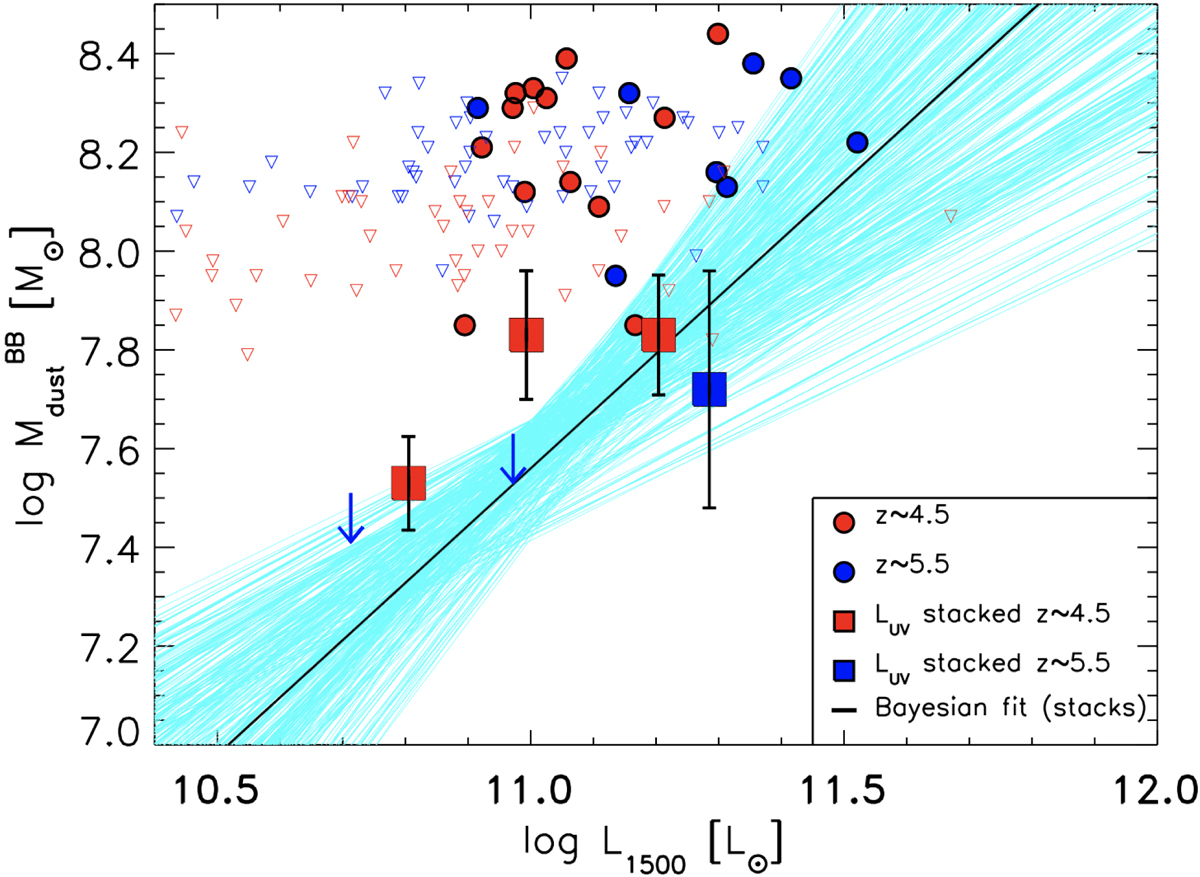
Fig. 4.
Download original image
Mdust vs. LUV for the ALPINE targets. Blue and red points show individual FIR continuum detections at 4 < z < 5 and 5 < z < 6, respectively. Open downward triangles show 3σ upper limits of individual IR non-detections. Stacks with detections at z < 5 and z > 5 are shown as blue and red squares, respectively. The non-detection of stacks are indicated by a downward arrows. Mdust from the stacked ALMA continuum fluxes were estimated using the same expression as for the targets (Eq. (1)). The Bayesian linear fit of all the stacked values (detections and upper limits) is shown by the black and light blue lines, which also illustrate the probability distribution of the fit at 1σ confidence level. The resulting best fit is ![]() (dispersion
(dispersion ![]() dex, Pearson rank coefficient of 0.76 and p-value 0.08, with the Pearson coefficient computed considering all data as detections).
dex, Pearson rank coefficient of 0.76 and p-value 0.08, with the Pearson coefficient computed considering all data as detections).
Current usage metrics show cumulative count of Article Views (full-text article views including HTML views, PDF and ePub downloads, according to the available data) and Abstracts Views on Vision4Press platform.
Data correspond to usage on the plateform after 2015. The current usage metrics is available 48-96 hours after online publication and is updated daily on week days.
Initial download of the metrics may take a while.