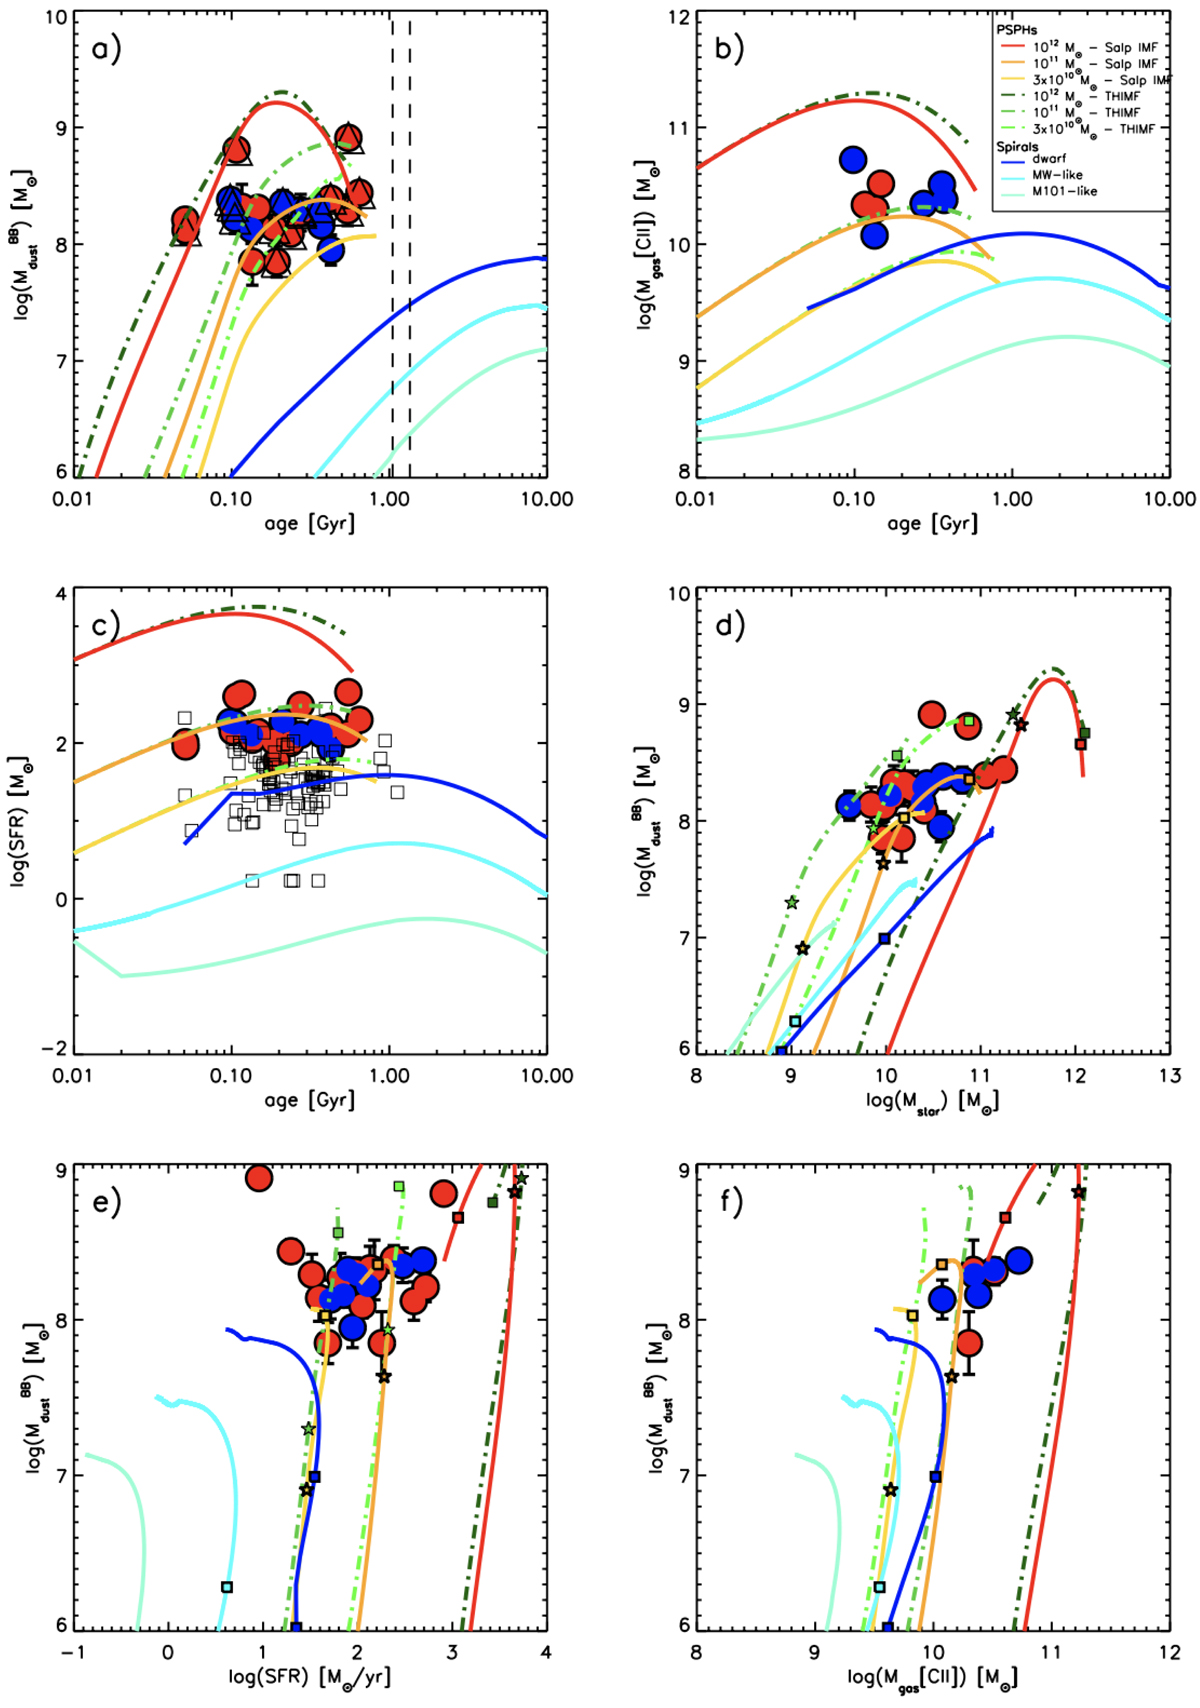
Fig. 2.
Download original image
Scaling relations of the ALPINE targets. Top panels: Mdust vs. age (panel a) and Mgas vs. age (b). Middle panels: SFR vs. age (c) and Mdust vs. M⋆ (d). Bottom panels: Mdust vs. SFR (e) and Mdust vs. Mgas (f). Mdust is computed by means of a MBB fit and assuming T = 25 K and β = 1.8. The blue and red points show detections at 4 < z < 5 and 5 < z < 6, respectively. In panel a the triangles around the points indicate galaxies classified as mergers or dispersion-dominated objects (Le Fèvre et al. 2020), whereas the black vertical dashed lines indicate the age of the Universe at redshift 4.5 and z = 5.5 (corresponding to an age of the Universe of 1.35 Gyr and 1.05 Gyr, respectively). The empty squares in panel c represent the ALPINE galaxies non-detected in continuum. The curves represent the chemical evolution models described in Sect. 4.1. The yellow, orange, and red solid lines represent proto-spheroid models of baryonic mass 3 × 10¹⁰, 1011, and 1012 M⊙, respectively, computed with a standard Salpeter IMF (Salpeter 1955). The light green, green, and dark green dot-dashed lines are for three PSPHs with the same baryonic masses as above, but characterised by a top-heavy IMF (Larson 1998). The light cyan, cyan, and blue solid lines represent models for a dwarf spiral, an intermediate-mass spiral, and an M101-like spiral, respectively (Calura et al. 2017). The stars and squares plotted along each curve and in the same colour indicate the evolutionary times of 0.1 and 0.5 Gyr, respectively.
Current usage metrics show cumulative count of Article Views (full-text article views including HTML views, PDF and ePub downloads, according to the available data) and Abstracts Views on Vision4Press platform.
Data correspond to usage on the plateform after 2015. The current usage metrics is available 48-96 hours after online publication and is updated daily on week days.
Initial download of the metrics may take a while.