Free Access
Fig. 5
Download original image
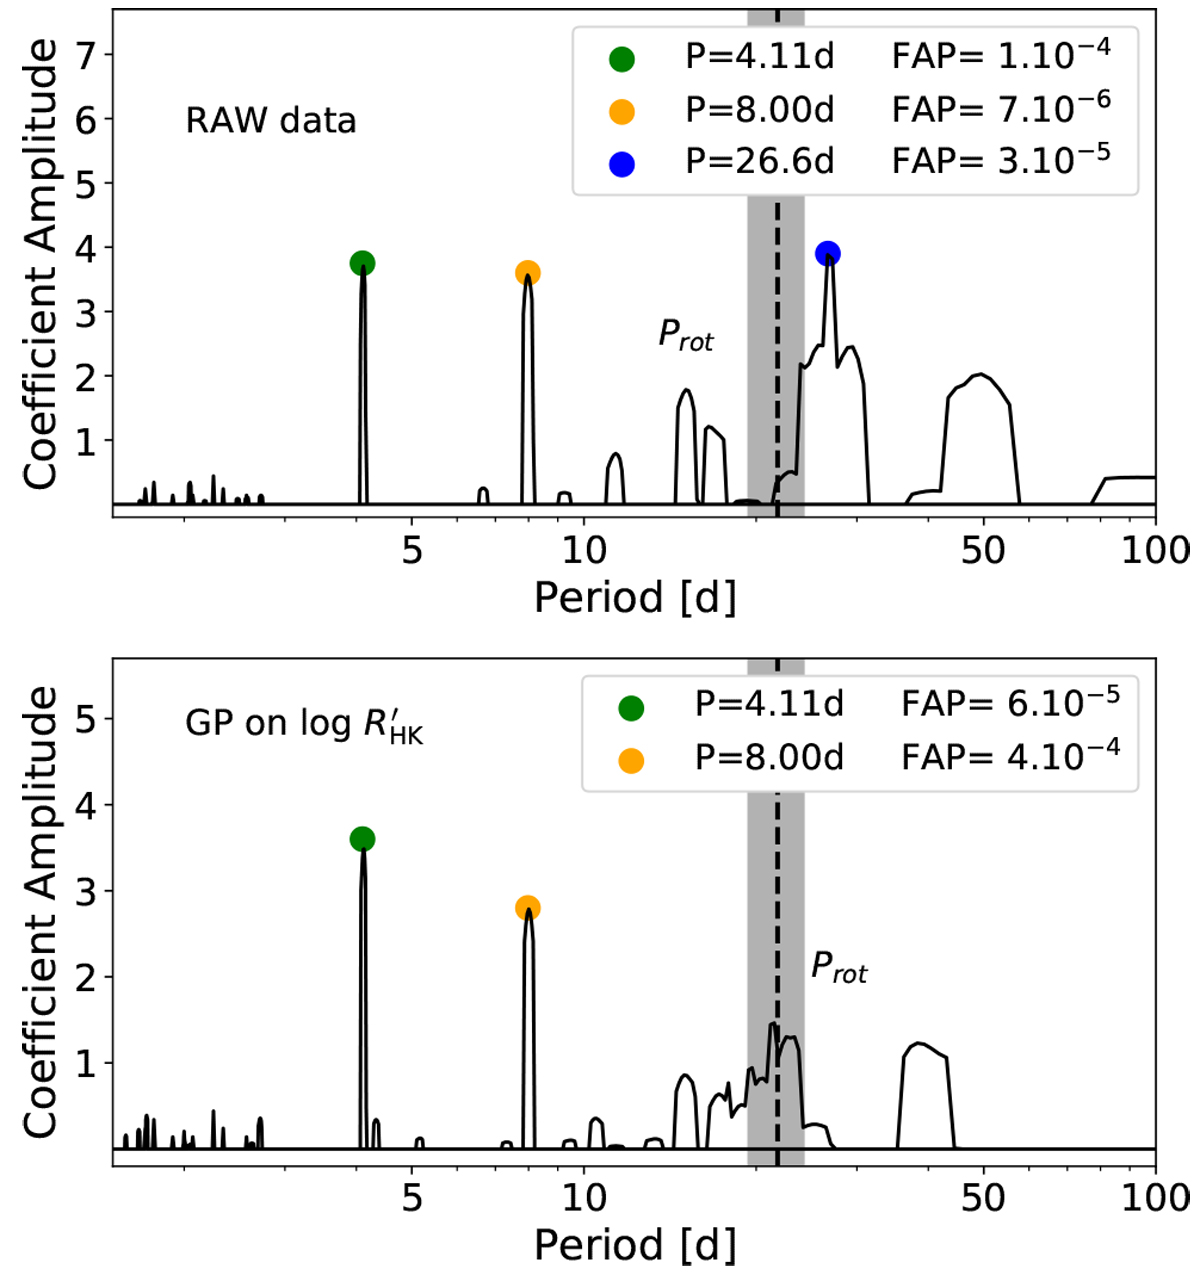
Undetrended RVs (top) and detrended RVs (bottom) obtained via the
l1 periodogramusing Gaussian processes on the ![]() indicator with SPLEAF. The periods at which the significant peaks occur (FAP < 10−3) are color-coded (see inset). The stellar rotational period determined through the TESS data is highlighted in gray.
indicator with SPLEAF. The periods at which the significant peaks occur (FAP < 10−3) are color-coded (see inset). The stellar rotational period determined through the TESS data is highlighted in gray.
Current usage metrics show cumulative count of Article Views (full-text article views including HTML views, PDF and ePub downloads, according to the available data) and Abstracts Views on Vision4Press platform.
Data correspond to usage on the plateform after 2015. The current usage metrics is available 48-96 hours after online publication and is updated daily on week days.
Initial download of the metrics may take a while.