Fig. 1
Download original image
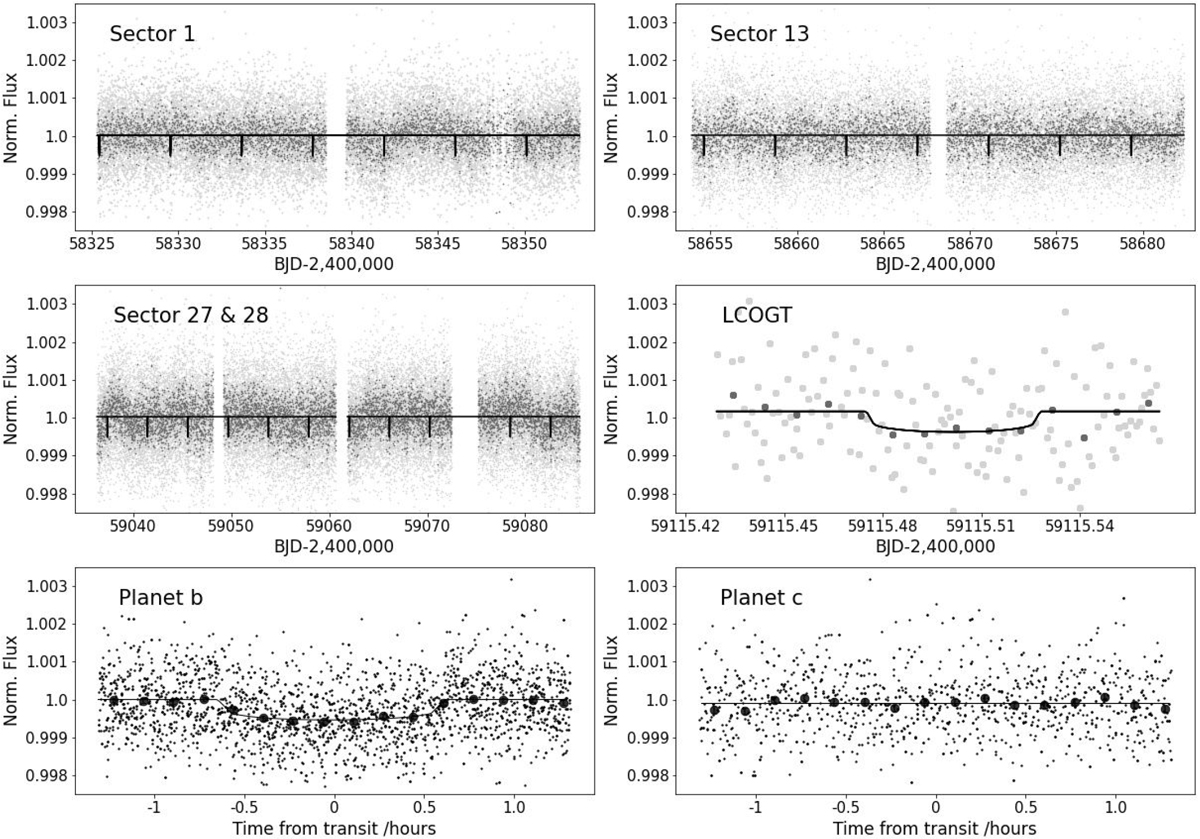
TESS photometry from the of TOI 1062 from Sectors 1 (upper left), 13 (upper right), and Sectors 27 and 28 (middle left), and LCOGT photometry (middle right). The TESS light curves correspond to the PDC-SAP flux time series provided by SPOC. The TESS full light curve with the 2 min cadence data is shown in light gray, and the same data binnedto 10 min is in dark gray. The gaps in the data coverage are due to observation interruptions of the TESS spacecraft that occur after each TESS orbit of 13.7 days. The dots of the LCOGT are bigger for better visualization. The lower panels shows the phase-folded TESS light curves for TOI 1062b (left) and TOI 1062c (right) with the 2 min cadence data in light gray and binned to 10 min in black. We find that TOI 1062c does not transit.
Current usage metrics show cumulative count of Article Views (full-text article views including HTML views, PDF and ePub downloads, according to the available data) and Abstracts Views on Vision4Press platform.
Data correspond to usage on the plateform after 2015. The current usage metrics is available 48-96 hours after online publication and is updated daily on week days.
Initial download of the metrics may take a while.