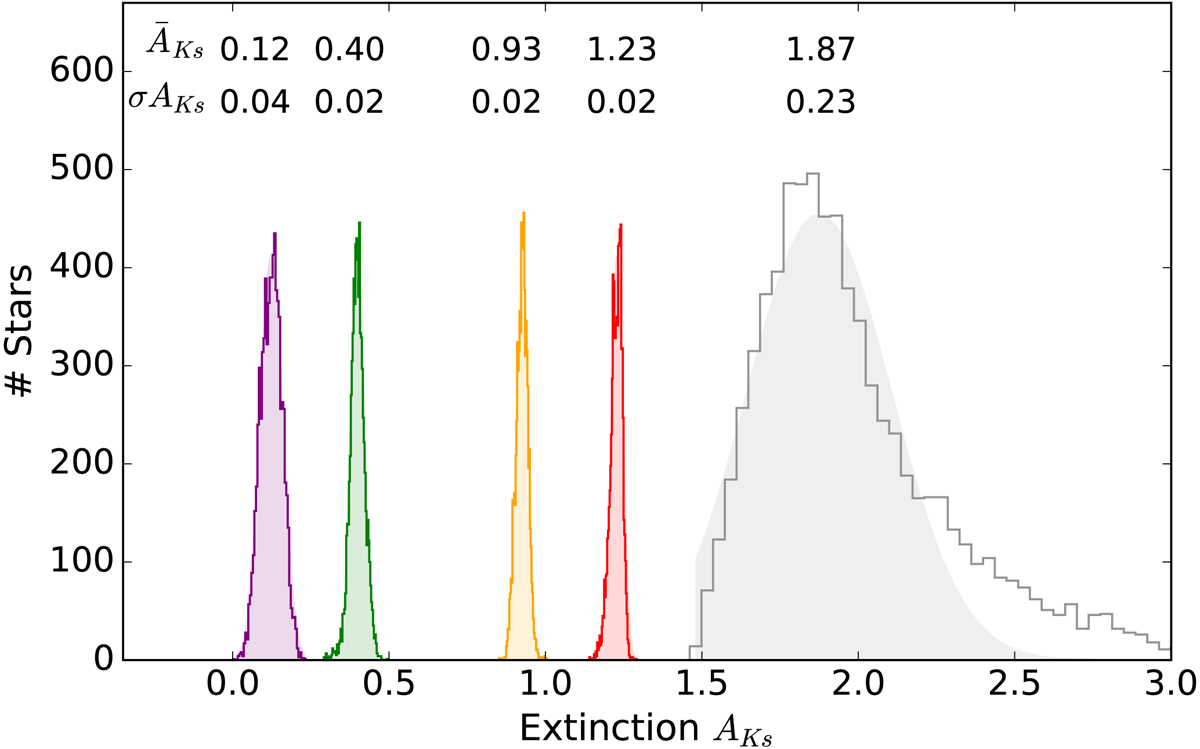
Fig. 9.
Download original image
Histograms of the AKs values per pixel in the extinction maps. The purple, green, orange, and red histograms correspond to the spiral arms. The grey histogram was obtained using the extinction map in Nogueras-Lara et al. (2020a), corresponding to the central region of the NSD. Given the smaller area of the NSD extinction map, the spiral arm histograms were properly scaled. Filled coloured contours show Gaussian fits, whose mean and standard deviation are indicated in the figure.
Current usage metrics show cumulative count of Article Views (full-text article views including HTML views, PDF and ePub downloads, according to the available data) and Abstracts Views on Vision4Press platform.
Data correspond to usage on the plateform after 2015. The current usage metrics is available 48-96 hours after online publication and is updated daily on week days.
Initial download of the metrics may take a while.