Fig. 8.
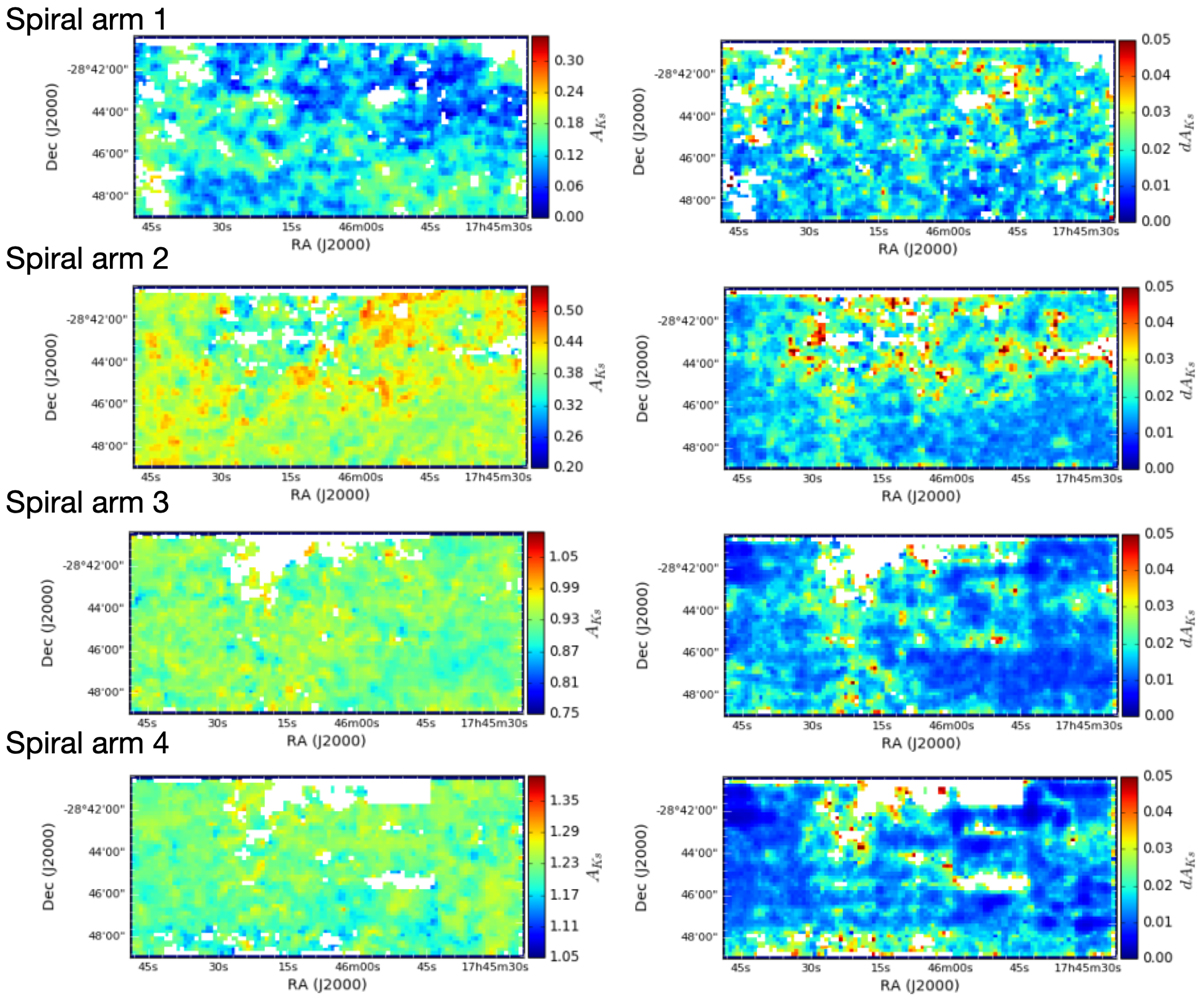
Download original image
Left column: extinction maps corresponding to each spiral arm. Right column: associated uncertainties obtained using a jackknife algorithm (see main text for further details). White pixels indicate regions where the number of reference stars is not enough to compute an extinction value. The white rectangle in the upper part of the fourth spiral arm corresponds to a region of poor quality data in H band (see Table A.1. in Nogueras-Lara et al. 2019a). Given the increase in extinction for further spiral arms, the colour scale is different for each of the extinction maps. The extinction range is always the same, 0.35 mag, in order to make small extinction variations within the same extinction layer visible.
Current usage metrics show cumulative count of Article Views (full-text article views including HTML views, PDF and ePub downloads, according to the available data) and Abstracts Views on Vision4Press platform.
Data correspond to usage on the plateform after 2015. The current usage metrics is available 48-96 hours after online publication and is updated daily on week days.
Initial download of the metrics may take a while.