Fig. 7.
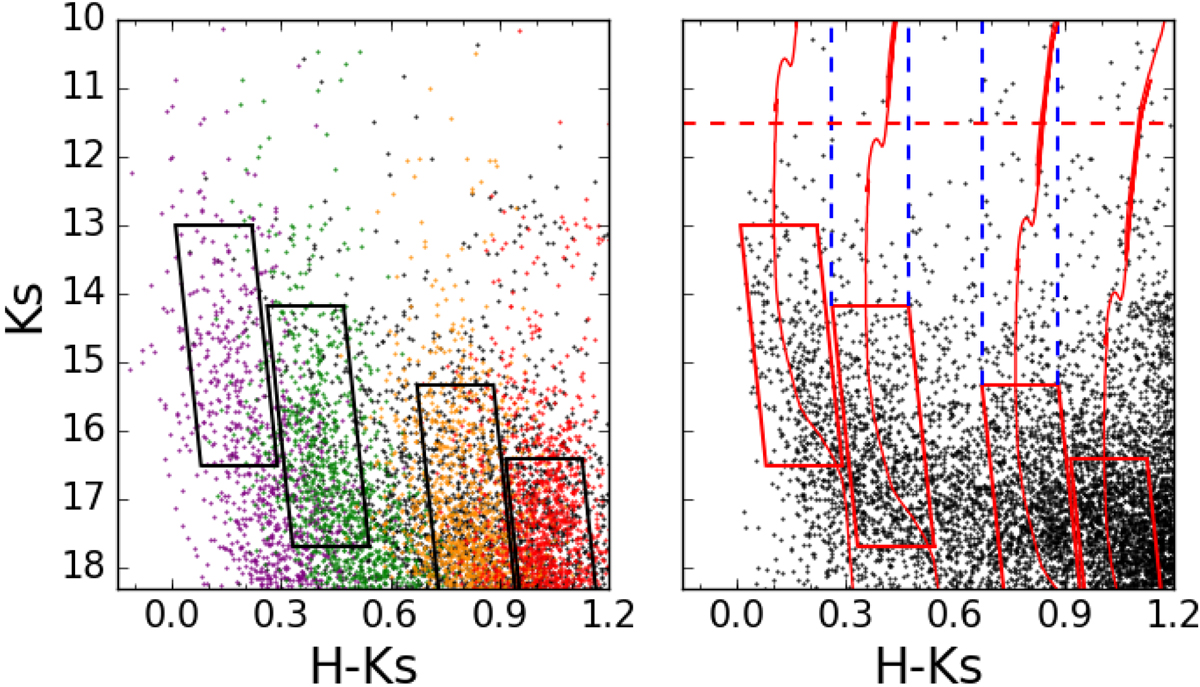
Download original image
Colour–magnitude diagrams Ks vs. H − Ks. Left panel: best model-fit solution obtained for the CMD Ks vs. H − Ks (see Table 2). Different colours indicate the stars contributing from each of the spiral arms. In particular, purple, green, orange, red, and black dots indicate stars from the first, second, third, and fourth spiral arms, and background sources respectively. Black solid parallelograms mark the selection of reference (mainly main-sequence) stars to analyse the extinction corresponding to each of the spiral arms. Right panel: real data considering completeness correction as indicated in Sect. 3.3. The red dashed line indicates the saturation limit of the Ks photometry (Ks = 11.5 mag). The red solid parallelograms depict the reference main sequence stars according to the best model fit as shown in the left panel. The isochrones corresponding to a stellar population of 1 Gyr and [M/H]= − 0.07 are over-plotted in red (see Sect. 3.3). The blue dashed lines indicate the stars added to the reference main sequence stars to create a Ks luminosity function for the second and third features (see Sect. 7).
Current usage metrics show cumulative count of Article Views (full-text article views including HTML views, PDF and ePub downloads, according to the available data) and Abstracts Views on Vision4Press platform.
Data correspond to usage on the plateform after 2015. The current usage metrics is available 48-96 hours after online publication and is updated daily on week days.
Initial download of the metrics may take a while.