Fig. 6.
Download original image
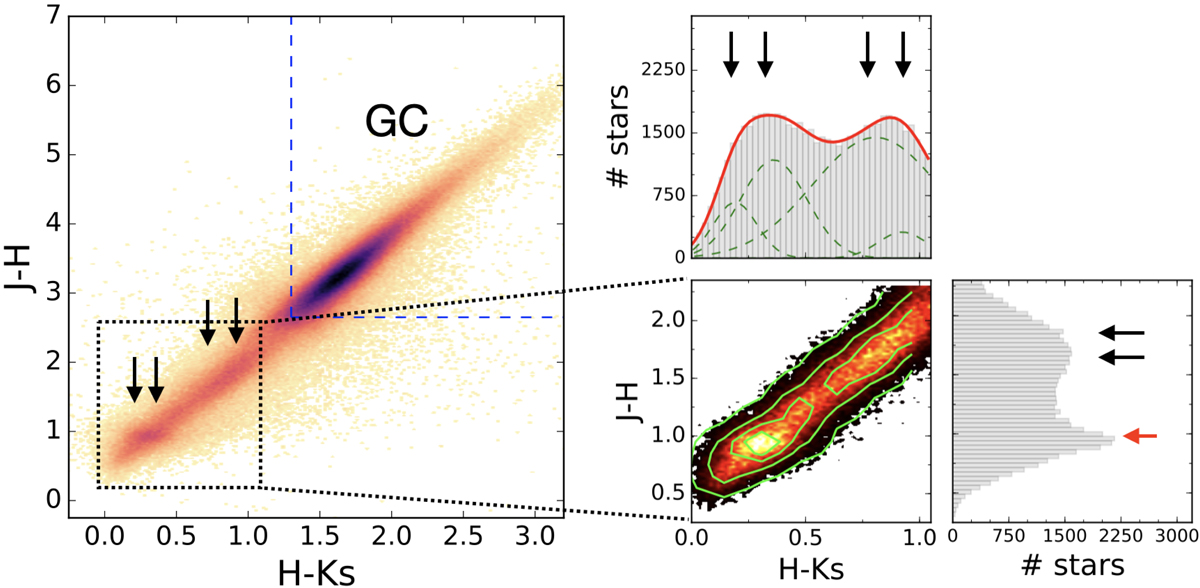
Left panel: colour–colour diagram J − H vs. H − Ks corresponding to the central region of the GALACTICNUCLEUS survey. The black arrows indicate the over-density features that correspond to the spiral arms detected in Sect. 3. The blue dashed lines mark the stellar population belonging to the GC, where the density is significantly different from the rest. Right panel: zoom into the foreground population from the spiral arms and histograms corresponding to the underlying distributions. The red solid line indicates the result of a four-Gaussian fit (green dashed lines for each individual Gaussian). The black arrows show the mean location of the spiral arms. The red arrow indicates the overlap between the first and the second spiral arms in one single feature in the histogram J − H.
Current usage metrics show cumulative count of Article Views (full-text article views including HTML views, PDF and ePub downloads, according to the available data) and Abstracts Views on Vision4Press platform.
Data correspond to usage on the plateform after 2015. The current usage metrics is available 48-96 hours after online publication and is updated daily on week days.
Initial download of the metrics may take a while.