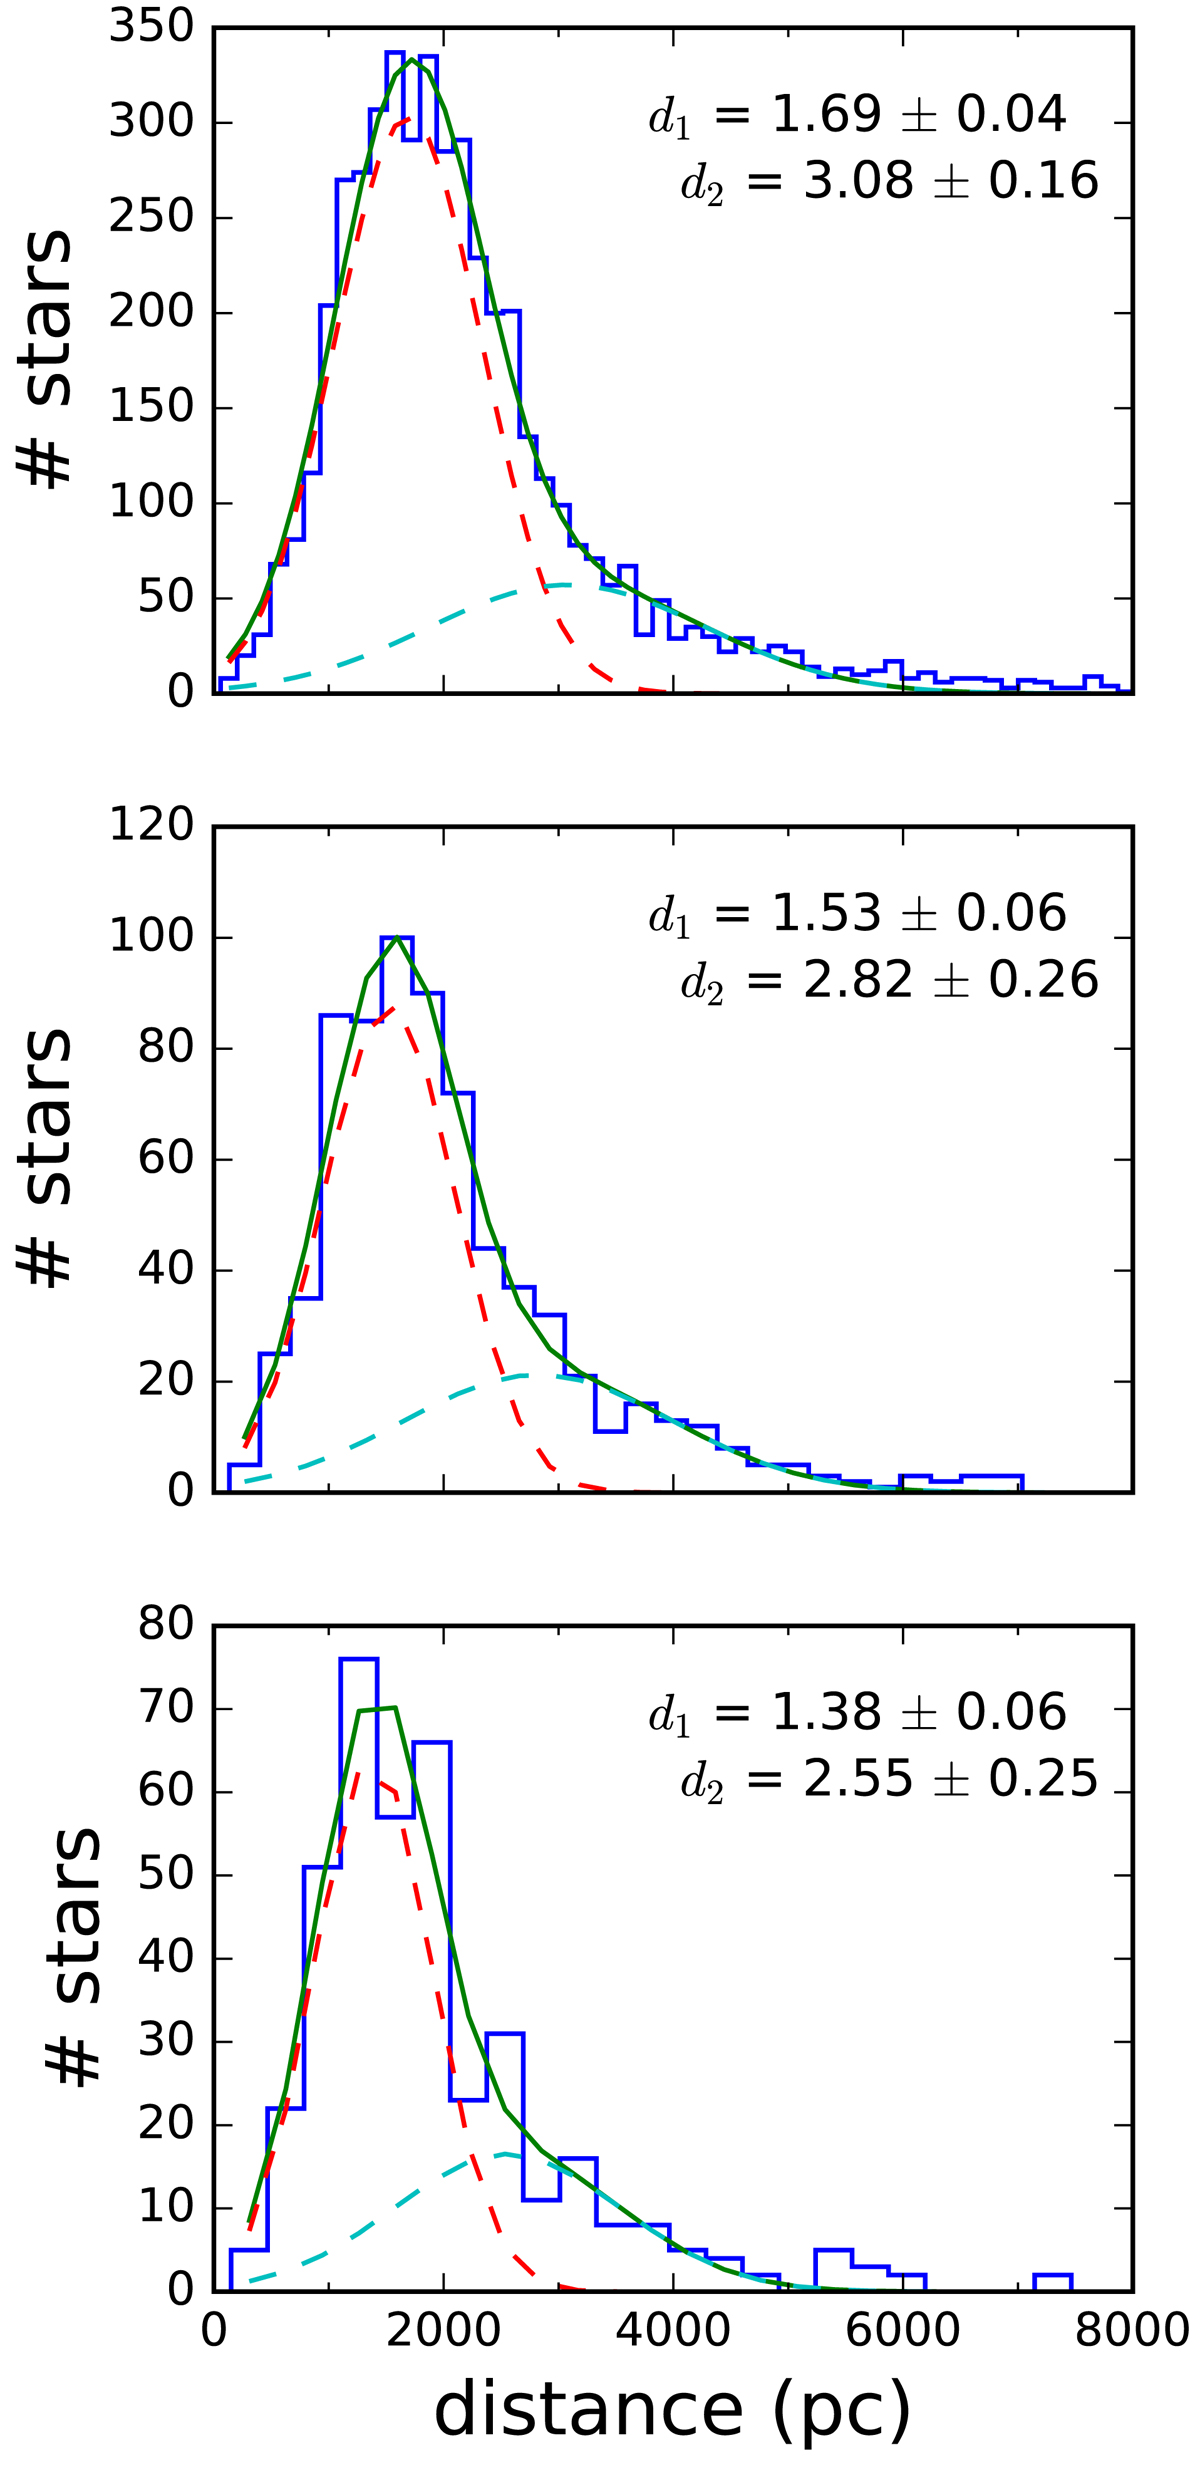
Fig. 5.
Download original image
Histograms of the distances to the common stars between Gaia and GALACTICNUCLEUS detected in the central, transition, and inner bulge regions (upper, middle, and lower panel, respectively). The solid green lines indicate the two-Gaussian fits, whereas the red and cyan dashed lines show each of the two Gaussian components. The mean values and their errors for each component are indicated for each panel in units of kpc.
Current usage metrics show cumulative count of Article Views (full-text article views including HTML views, PDF and ePub downloads, according to the available data) and Abstracts Views on Vision4Press platform.
Data correspond to usage on the plateform after 2015. The current usage metrics is available 48-96 hours after online publication and is updated daily on week days.
Initial download of the metrics may take a while.