Fig. 8.
Download original image
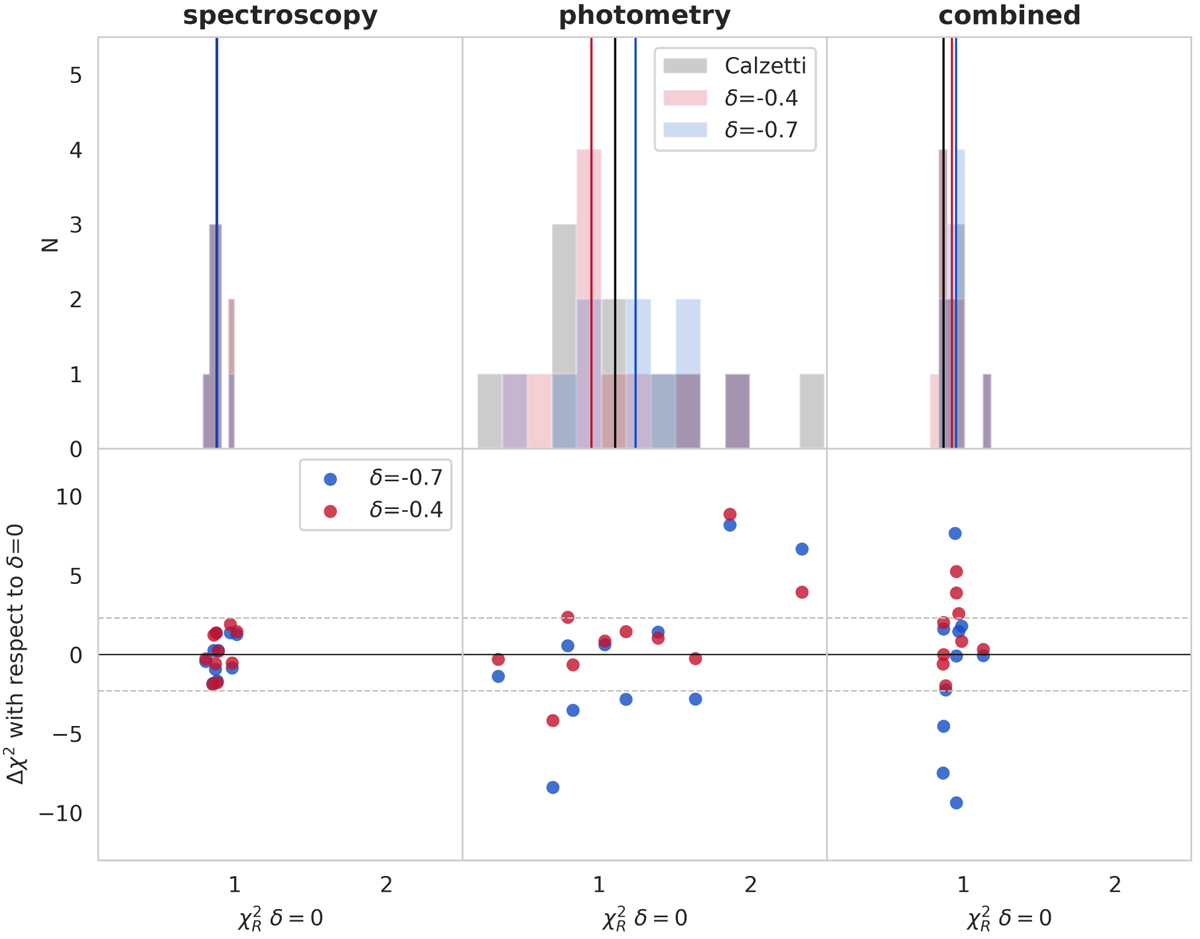
Top: reduced χ2 distributions of the fits to the spectroscopy (left), photometry (middle), and the combined data sets (right panel) as a function of the extinction law. Vertical lines mark the medians of the distributions. Bottom: χ2 difference of the best-fitting solutions obtained using δ = −0.4 and δ = −0.7 with respect to δ = 0. Grey dashed lines mark the levels of ±Δχ2 = 2.3.
Current usage metrics show cumulative count of Article Views (full-text article views including HTML views, PDF and ePub downloads, according to the available data) and Abstracts Views on Vision4Press platform.
Data correspond to usage on the plateform after 2015. The current usage metrics is available 48-96 hours after online publication and is updated daily on week days.
Initial download of the metrics may take a while.