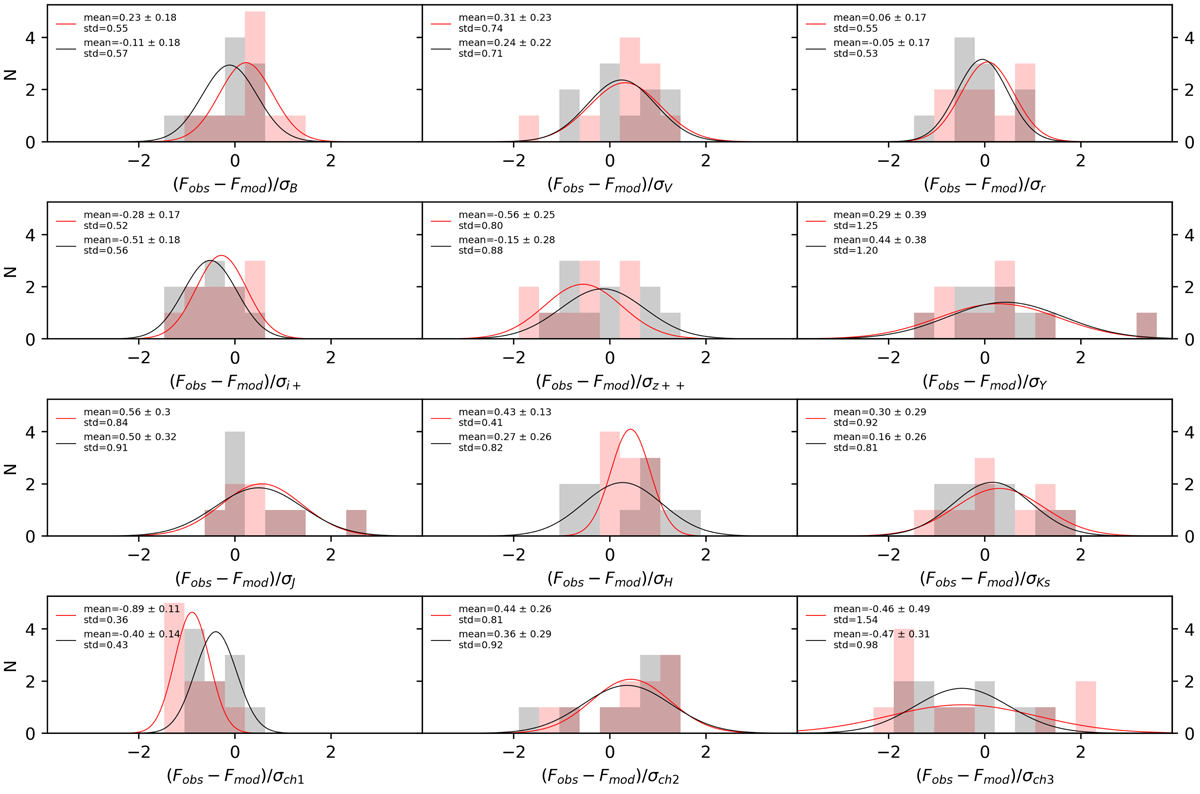
Fig. 6.
Download original image
Normalised residual distribution of target galaxies in each photometric band. Red and black histograms show residuals adopting recalibrated and original photometric zero-points, respectively. Solid red and black curves show Gaussian fits to these distributions. Their means, standard mean errors, and standard deviations are listed in each panel.
Current usage metrics show cumulative count of Article Views (full-text article views including HTML views, PDF and ePub downloads, according to the available data) and Abstracts Views on Vision4Press platform.
Data correspond to usage on the plateform after 2015. The current usage metrics is available 48-96 hours after online publication and is updated daily on week days.
Initial download of the metrics may take a while.