Fig. 5.
Download original image
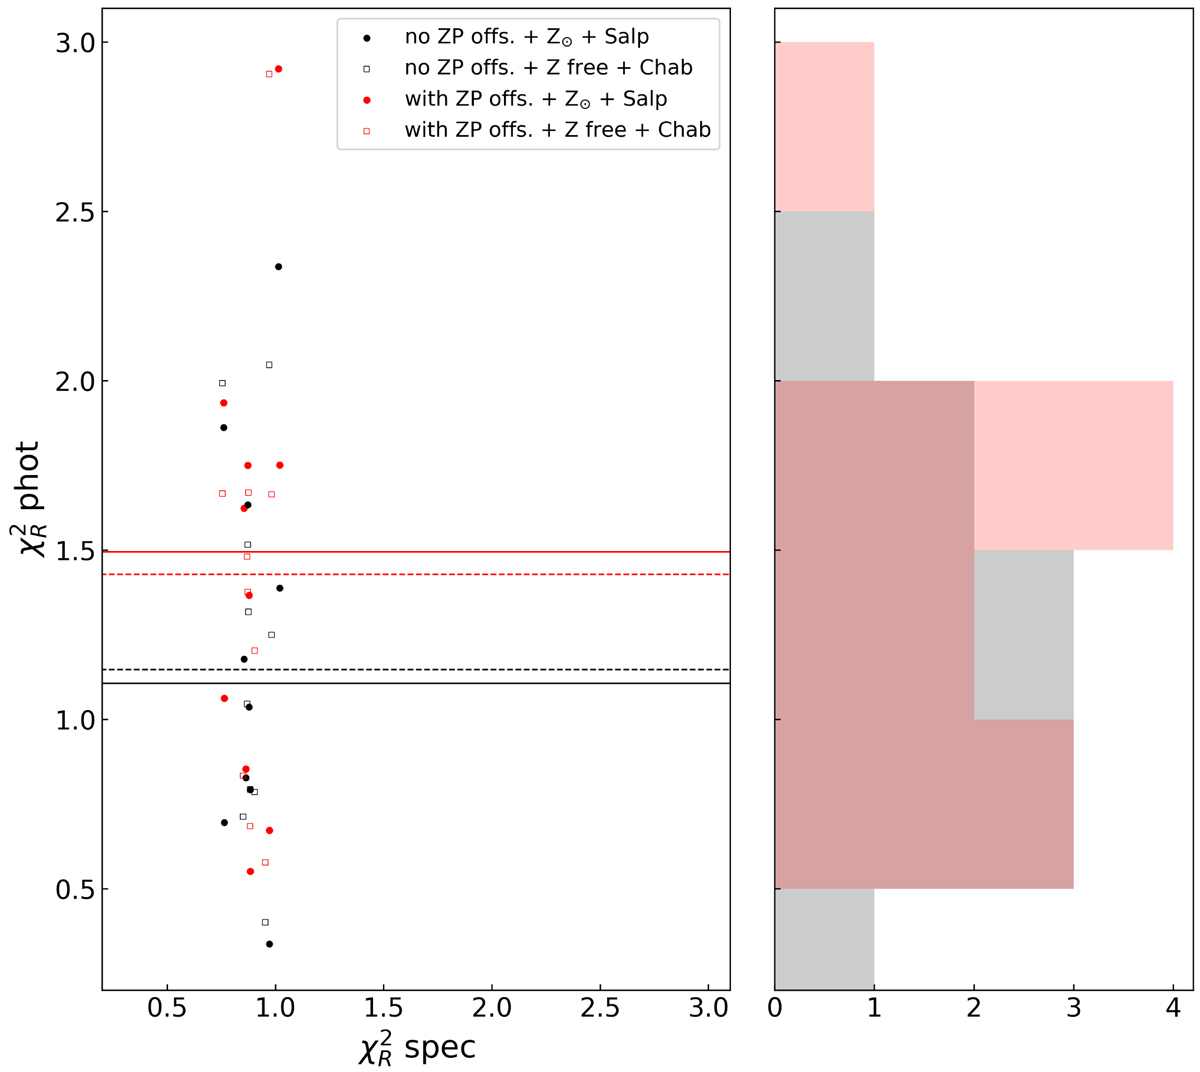
Distributions of photometric reduced χ2 before (red dots) and after removing the ZPs re-calibration (black dots). Median values are marked with solid red and black lines. ![]() values obtained adopting a Chabrier IMF and leaving the metallicity free to vary are shown as empty squares. Their corresponding medians are shown as dashed lines.
values obtained adopting a Chabrier IMF and leaving the metallicity free to vary are shown as empty squares. Their corresponding medians are shown as dashed lines.
Current usage metrics show cumulative count of Article Views (full-text article views including HTML views, PDF and ePub downloads, according to the available data) and Abstracts Views on Vision4Press platform.
Data correspond to usage on the plateform after 2015. The current usage metrics is available 48-96 hours after online publication and is updated daily on week days.
Initial download of the metrics may take a while.