Fig. 2.
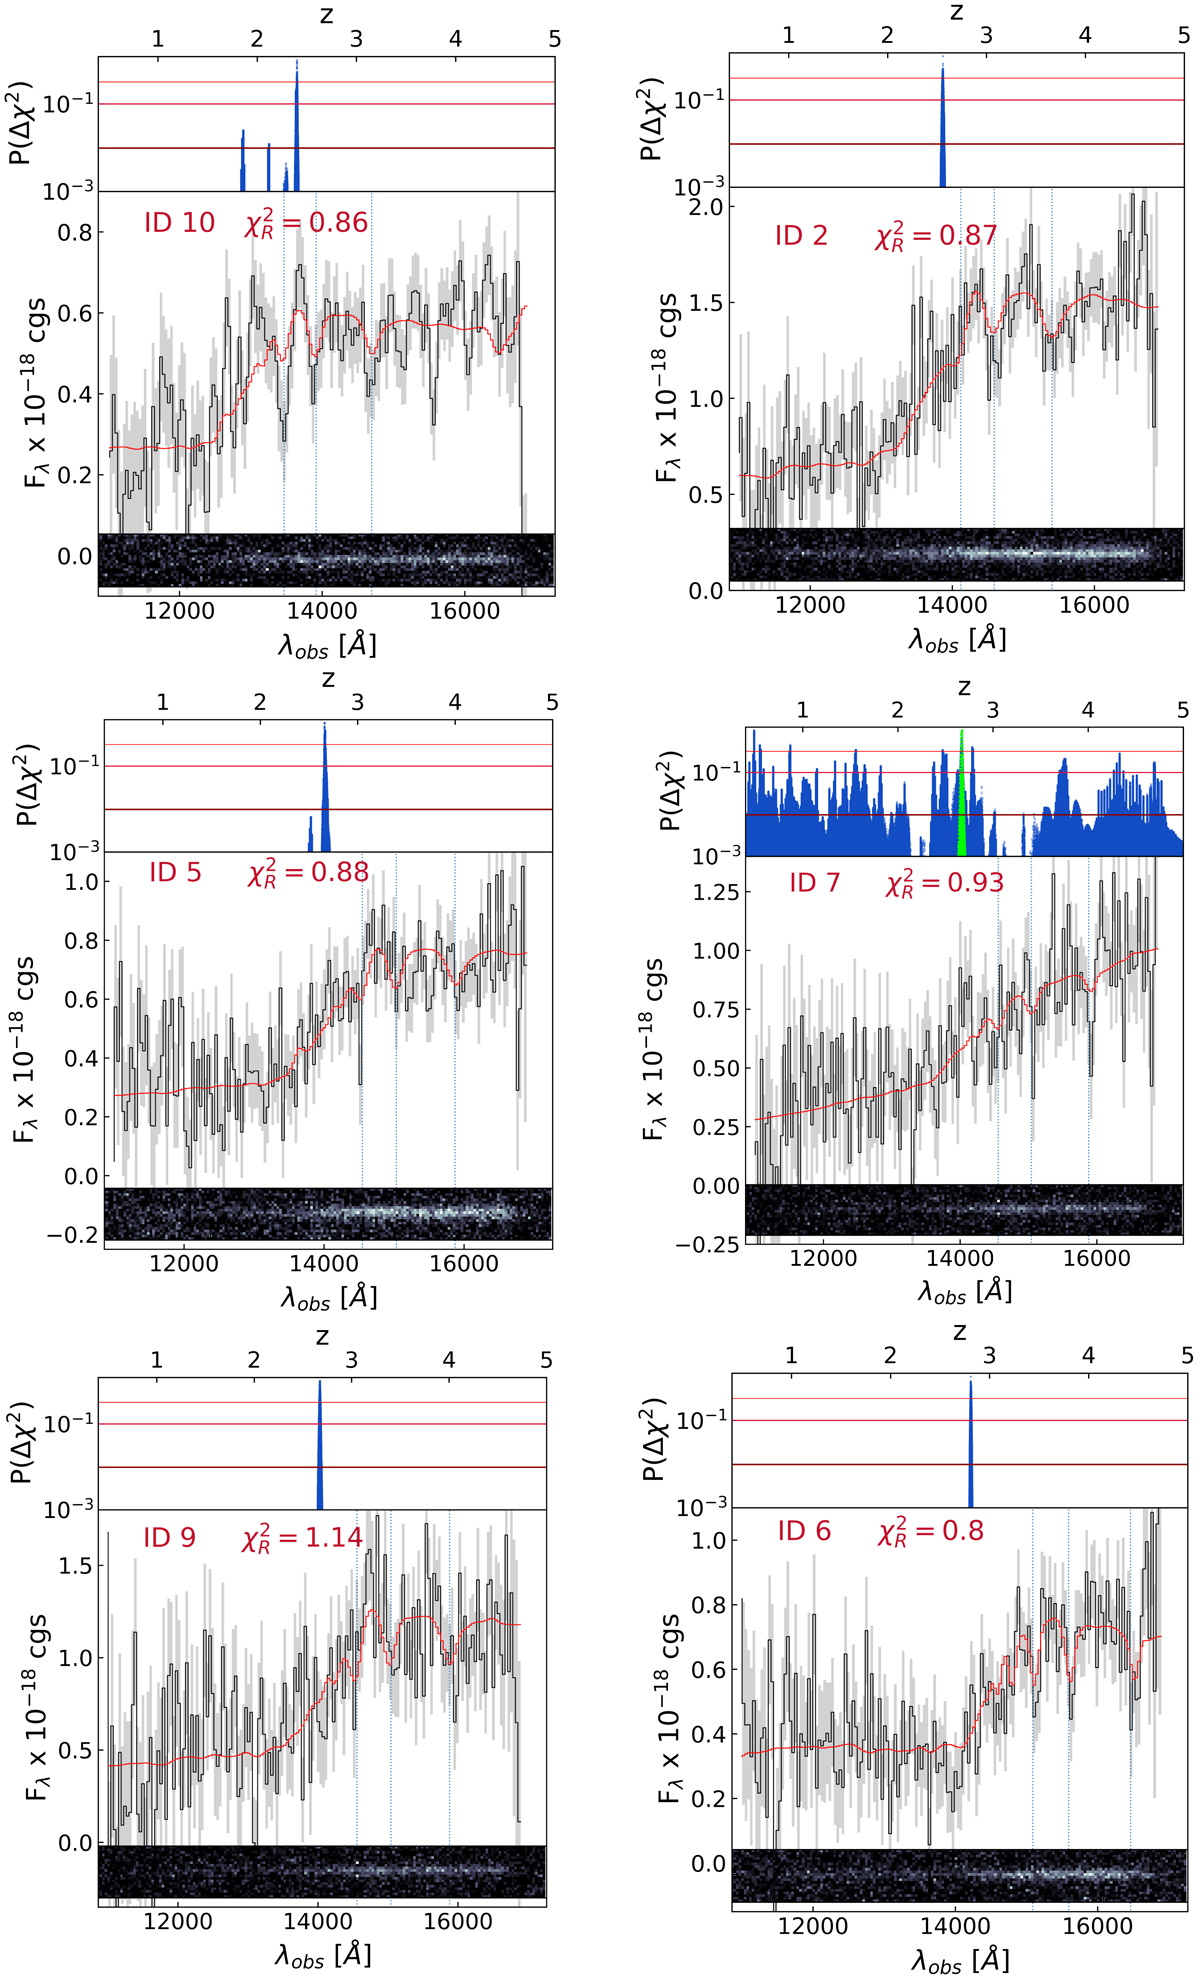
Download original image
Upper panels: redshift probability distribution for each target. Solid lines from light to dark red mark 1, 2, and 3σ confidence levels. Green points for ID 7 mark the redshift solutions obtained by combining spectroscopy and photometry as described in Sect. 4.2. Middle panels: optimally extracted 1D grism spectra (black) and best-fitting solutions (red) of our targets. The noise vector is shown in grey in each panel. Bottom panels: corresponding 2D G141 spectra. The colour scale is in linear scale. Galaxies are shown in order of increasing redshift.
Current usage metrics show cumulative count of Article Views (full-text article views including HTML views, PDF and ePub downloads, according to the available data) and Abstracts Views on Vision4Press platform.
Data correspond to usage on the plateform after 2015. The current usage metrics is available 48-96 hours after online publication and is updated daily on week days.
Initial download of the metrics may take a while.