Fig. 14.
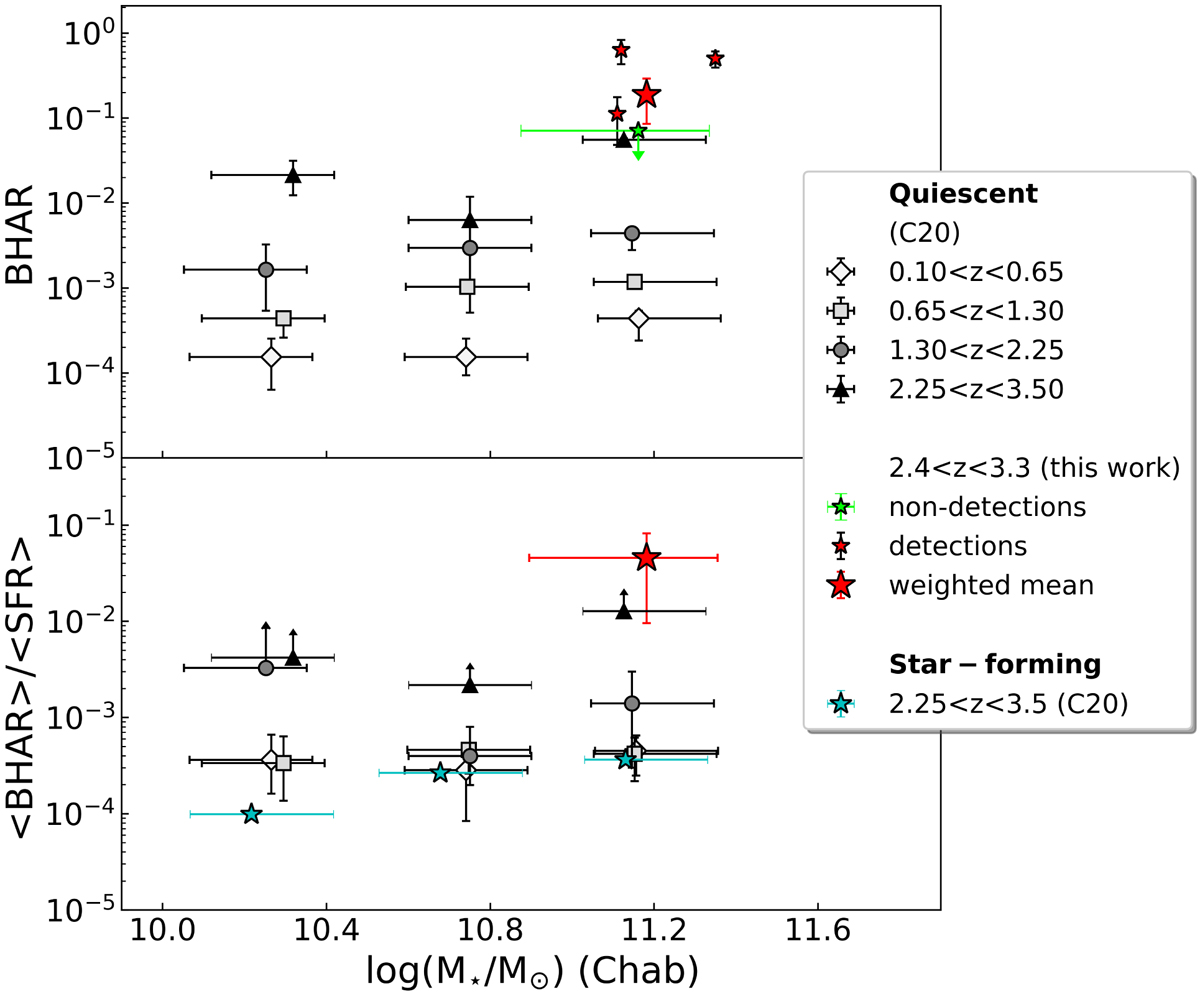
Download original image
BHAR (top) and BHAR per unit SFR (bottom) as a function of stellar mass for quiescent galaxies (greyscale points) in COSMOS. Different symbols mark different redshift bins. Main-sequence galaxies in the same redshift range as studied in this work are added in the bottom panel as cyan stars. Error bars on the average BHAR reflect the dispersion of the weighted mean on the rest frame L(2–10 keV) of the sample. The average SFR[OII] was converted into a Chabrier IMF. Adapted from Carraro et al. (2020).
Current usage metrics show cumulative count of Article Views (full-text article views including HTML views, PDF and ePub downloads, according to the available data) and Abstracts Views on Vision4Press platform.
Data correspond to usage on the plateform after 2015. The current usage metrics is available 48-96 hours after online publication and is updated daily on week days.
Initial download of the metrics may take a while.