Fig. 12.
Download original image
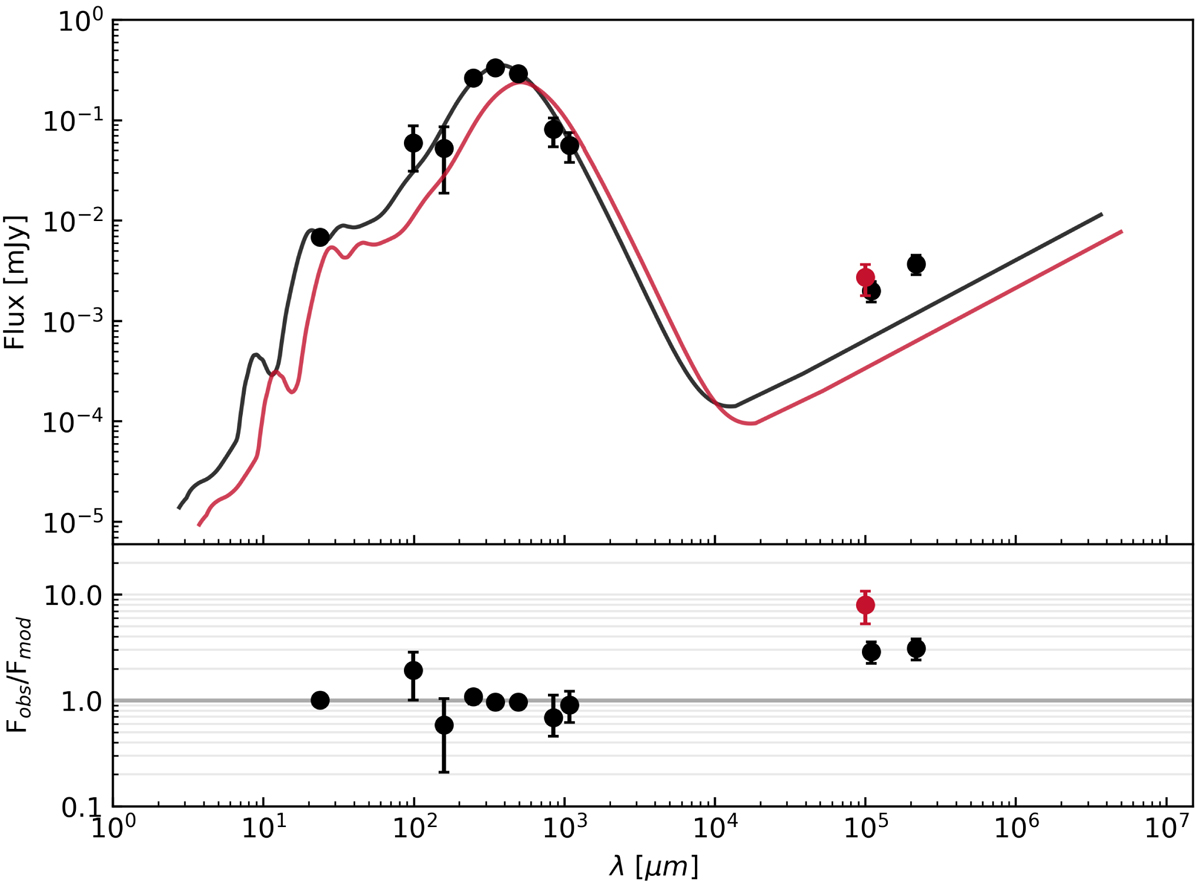
Radio excess observed in our galaxies compared to the average FIR-to-radio SED of similarly massive QGs at intermediate redshift. Top: observed 3 GHz flux for our sample (red dot) compared to the observed FIR-to-radio SED for ⟨M⋆⟩∼1.1 × 10¹¹ M⊙ galaxies at z ∼ 1.8 in Gobat et al. (2018) (black dots). The best-fitting template of Gobat et al. (2018) is shown as a black curve. The same template, but rescaled to our redshift and average SFR (D’Eugenio et al. 2020), is shown as a red curve. Bottom: observed flux normalised to the respective model at the corresponding wavelength.
Current usage metrics show cumulative count of Article Views (full-text article views including HTML views, PDF and ePub downloads, according to the available data) and Abstracts Views on Vision4Press platform.
Data correspond to usage on the plateform after 2015. The current usage metrics is available 48-96 hours after online publication and is updated daily on week days.
Initial download of the metrics may take a while.