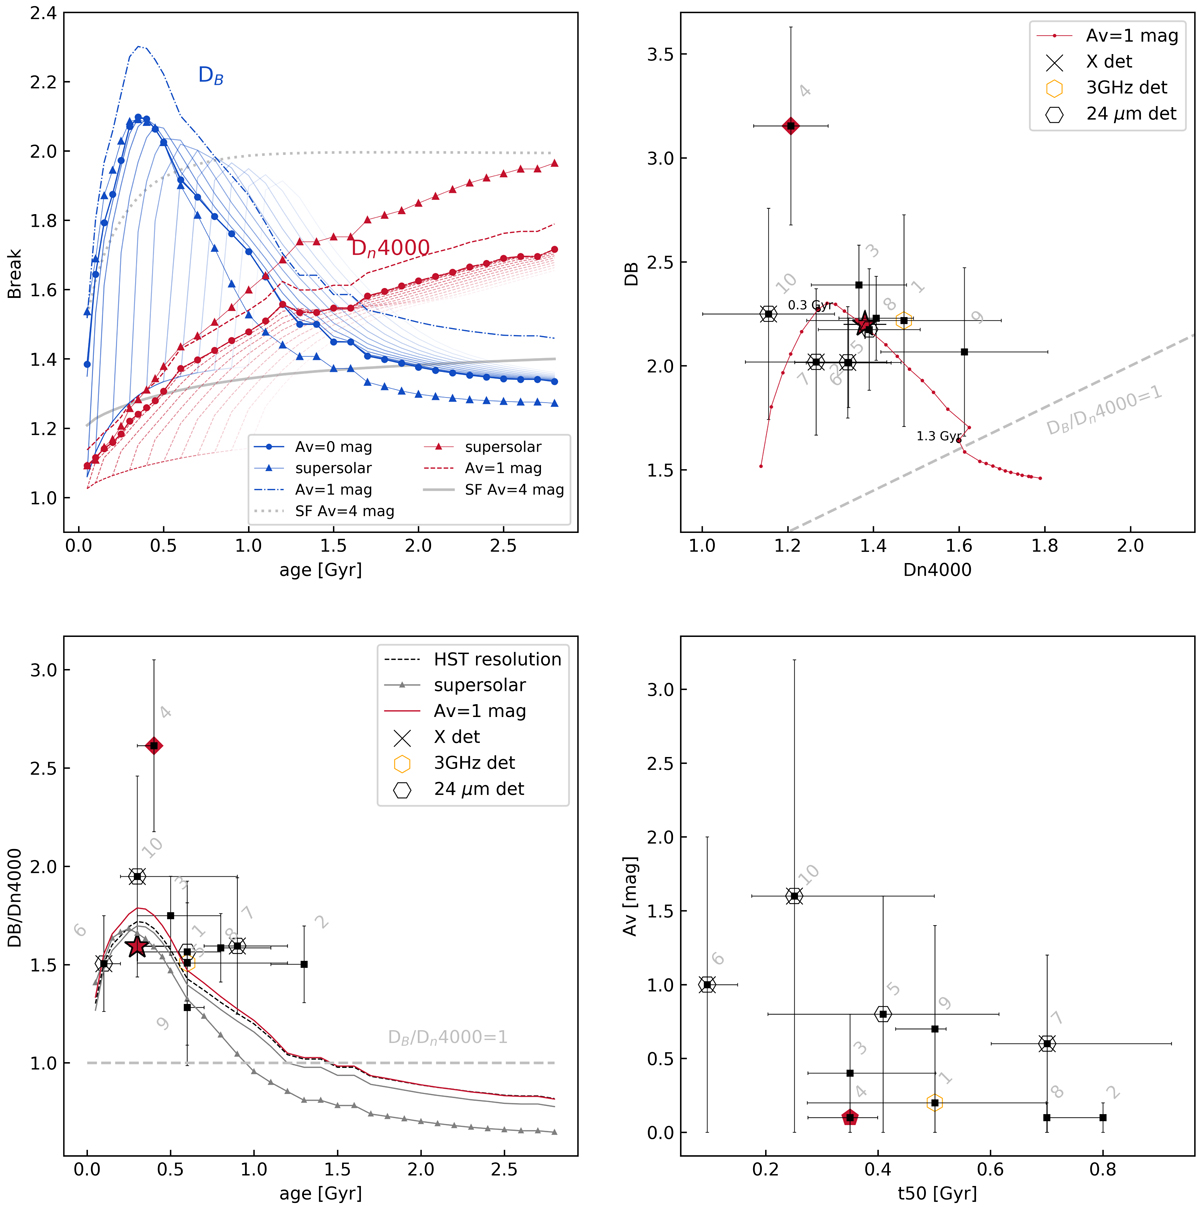
Fig. 11.
Download original image
Spectral indices and evolutionary properties derived for our galaxies. Upper left: variation in Balmer and 4000 Å breaks for CSPs as a function of their age using BC03 templates at solar metallicity. Lighter curves mark the evolution for a truncated SFH with increasing duration of star formation. The effect of adopting templates of different metallicity is displayed for the values that produce the largest variation, i.e., 2.5Z⊙ (triangles). Dotted and solid grey curves show the behaviour of a constant SFH for the two breaks, respectively. Upper right: individual values of DB and Dn4000 for our targets. The red track shows their evolution with age and is attenuated by 1 mag. The dashed grey line marks the 1:1 relation. Lower left: variation of the index ratio as a function of age for an SSP-like template. The effect of smoothing templates to the HST resolution is shown by the dashed black curve. The effect of a AV = 1 mag attenuation is instead shown by the red curve. The full transition between a Balmer-dominated and a 4000 Å -dominated spectrum is flagged when DB/Dn4000 = 1 (dashed grey line), which occurs around 1.3 Gyr of passive evolution. Dark grey triangles mark the evolution for 2.5Z⊙ templates. Lower right: best-fit values for the dust attenuation and mass-weighted age from the combined fit. Chandra X-ray, VLA 3GHz, and Spitzer/MIPS 24 μm detections are marked by black crosses and yellow and black hexagons, respectively.
Current usage metrics show cumulative count of Article Views (full-text article views including HTML views, PDF and ePub downloads, according to the available data) and Abstracts Views on Vision4Press platform.
Data correspond to usage on the plateform after 2015. The current usage metrics is available 48-96 hours after online publication and is updated daily on week days.
Initial download of the metrics may take a while.