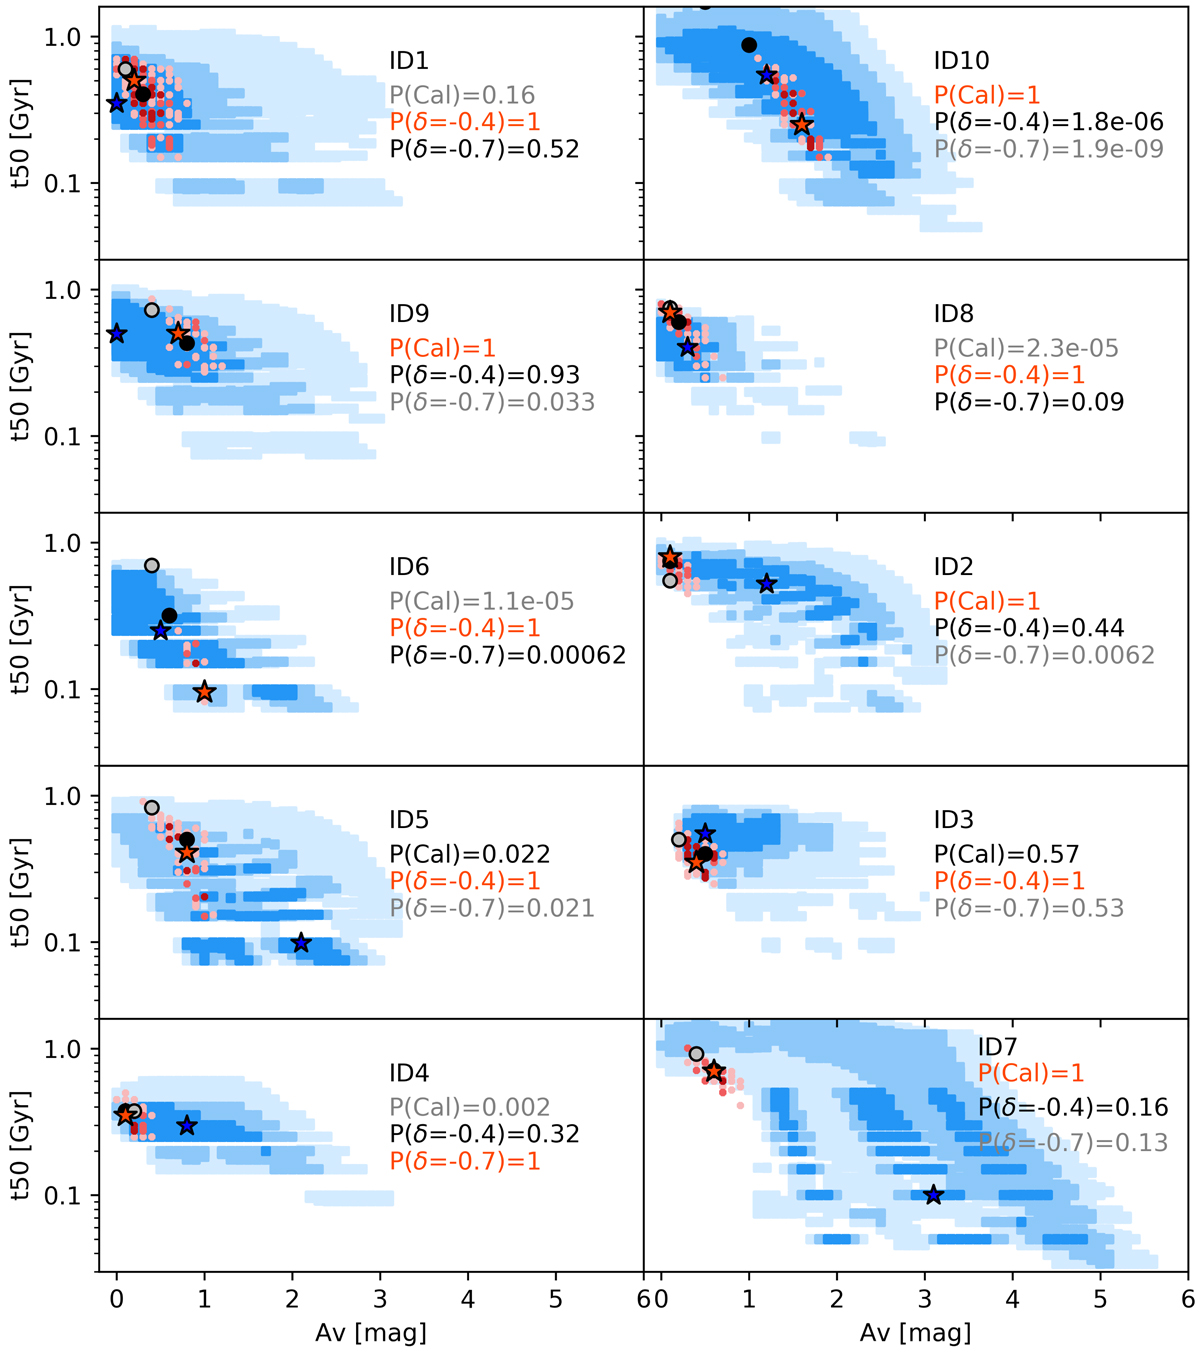
Fig. 10.
Download original image
Mass-weighted ages and dust extinction values for our targets. Blue squares mark the confidence regions (3 to 1 σ going from light to dark points) extracted from the spectra alone. Red points show the solutions of the combined fit. Blue and red stars in each panel mark the best-fit solution from the spectroscopic fit and the combined fit, respectively. The relative probabilities of the extinction laws are shown for each galaxy. As a reference, we report the best-fitting combined solution at fixed extinction law as black and grey dots. Their colour-coding follows that of the aforementioned relative probabilities.
Current usage metrics show cumulative count of Article Views (full-text article views including HTML views, PDF and ePub downloads, according to the available data) and Abstracts Views on Vision4Press platform.
Data correspond to usage on the plateform after 2015. The current usage metrics is available 48-96 hours after online publication and is updated daily on week days.
Initial download of the metrics may take a while.