Open Access
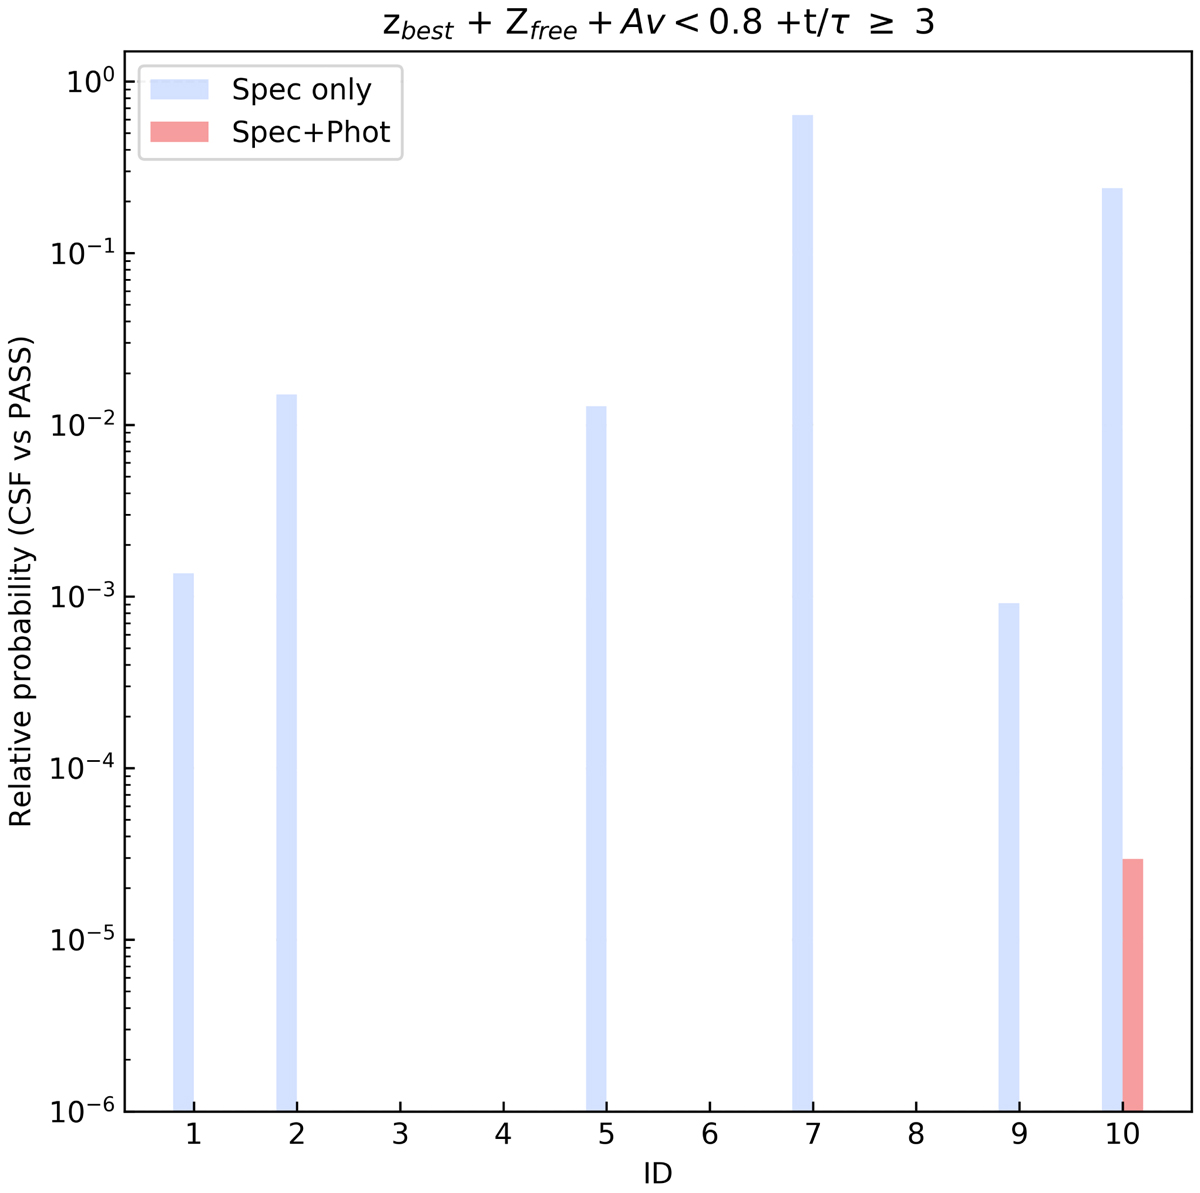
Fig. 9.
Download original image
Probability of constant star-forming solutions relative to that of passive solutions. Blue bars mark the results from spectroscopy alone. Red bars show the probabilities from the combined fit. Bars with relative probabilities lower than 10−6 are not shown.
Current usage metrics show cumulative count of Article Views (full-text article views including HTML views, PDF and ePub downloads, according to the available data) and Abstracts Views on Vision4Press platform.
Data correspond to usage on the plateform after 2015. The current usage metrics is available 48-96 hours after online publication and is updated daily on week days.
Initial download of the metrics may take a while.