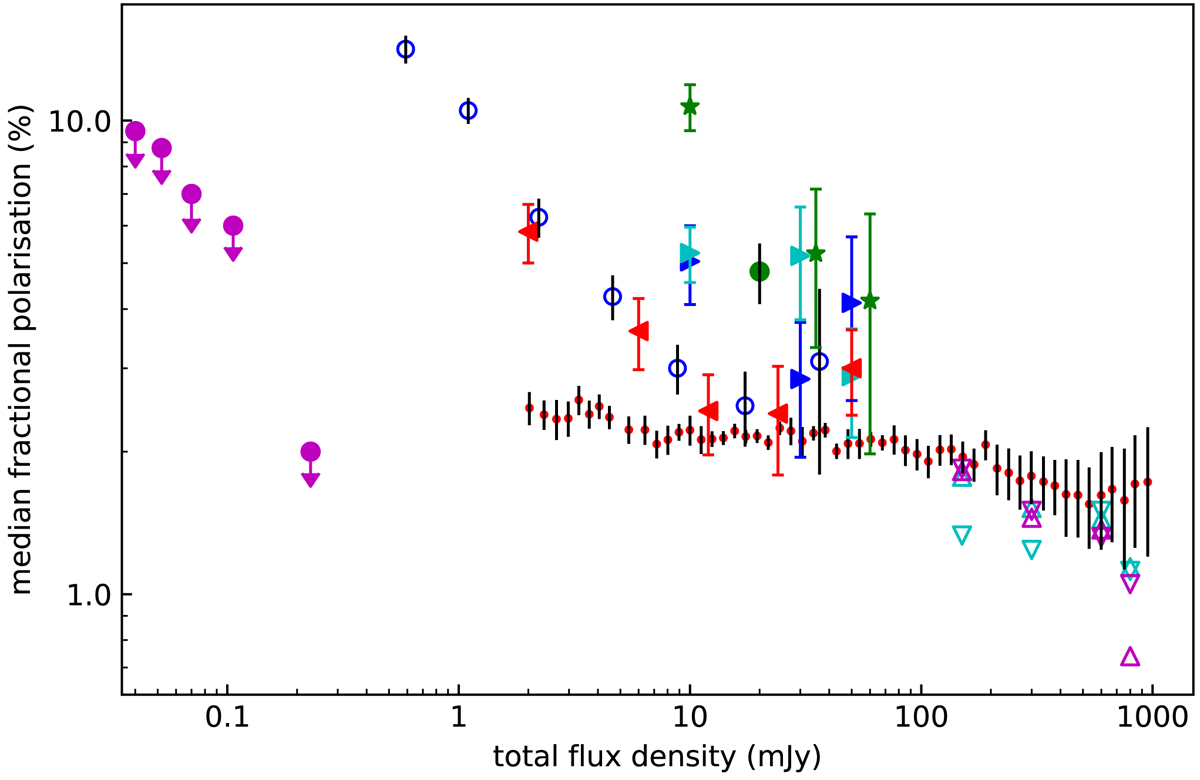
Fig. 9.
Download original image
Median fractional polarisation over total intensity for different catalogues. The red dots give the data points of Stil et al. (2014), who used the NVSS catalogue and a stacking technique, and the open turquoise upward (steep) and downward (flat) pointing triangles are the polarised sources from Tucci et al. (2004) of the NVSS split up by a spectral index of −0.5. The open magenta triangles represent the sources from Mesa et al. (2002) split by the same spectral index limit. The magenta circles represent upper limits from the catalogue of Rudnick & Owen (2014). The green stars are from Grant et al. (2010), the green circle from Taylor et al. (2007), and the blue open circles from Subrahmanyan et al. (2010). The triangles pointing to the right are the data from Hales et al. (2014a), the blue ones represent their data for the ELAIS-S1 field, and the turquoise ones their data for the CDF-S field. The red triangles pointing left represent our polarised sample.
Current usage metrics show cumulative count of Article Views (full-text article views including HTML views, PDF and ePub downloads, according to the available data) and Abstracts Views on Vision4Press platform.
Data correspond to usage on the plateform after 2015. The current usage metrics is available 48-96 hours after online publication and is updated daily on week days.
Initial download of the metrics may take a while.