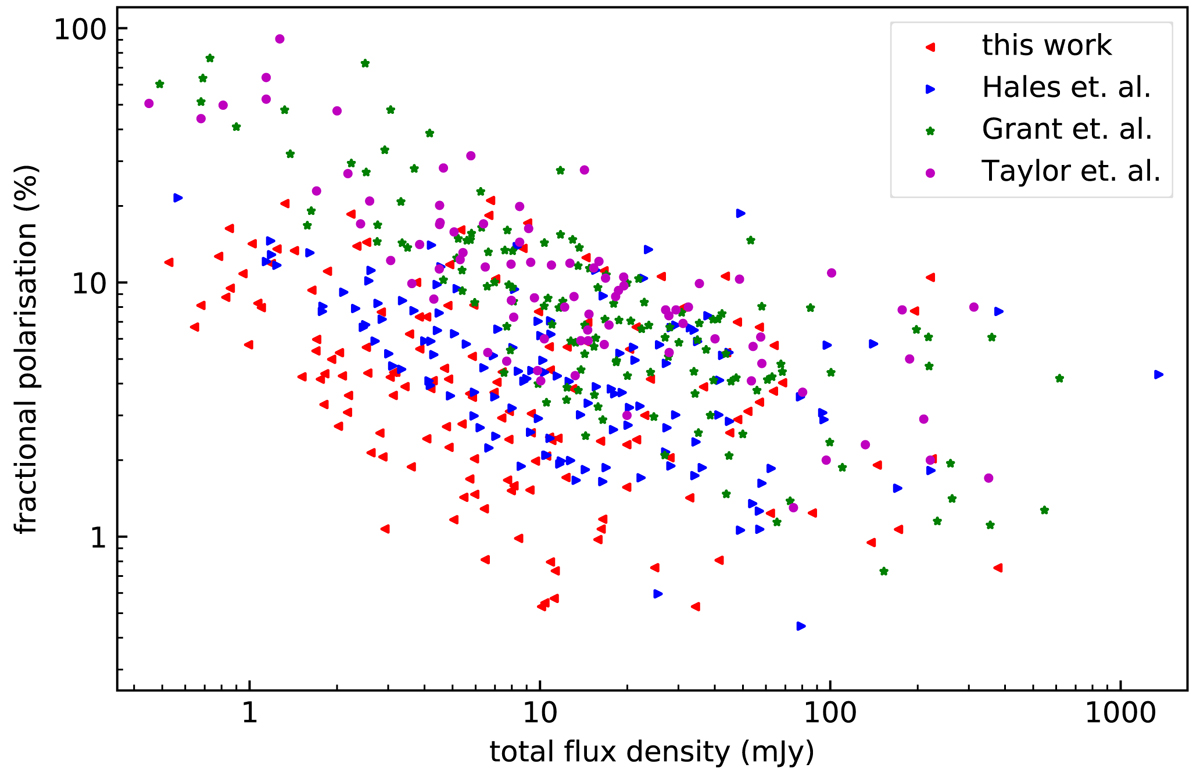
Fig. 7.
Download original image
Fractional polarisation over total intensity for sources from different publications. Red triangles pointing to the left represent the sources in this work, blue triangles pointing to the right the ones from Hales et al. (2014a), green stars the ones from Grant et al. (2010), and magenta circles the ones from Taylor et al. (2007).
Current usage metrics show cumulative count of Article Views (full-text article views including HTML views, PDF and ePub downloads, according to the available data) and Abstracts Views on Vision4Press platform.
Data correspond to usage on the plateform after 2015. The current usage metrics is available 48-96 hours after online publication and is updated daily on week days.
Initial download of the metrics may take a while.