Fig. 6.
Download original image
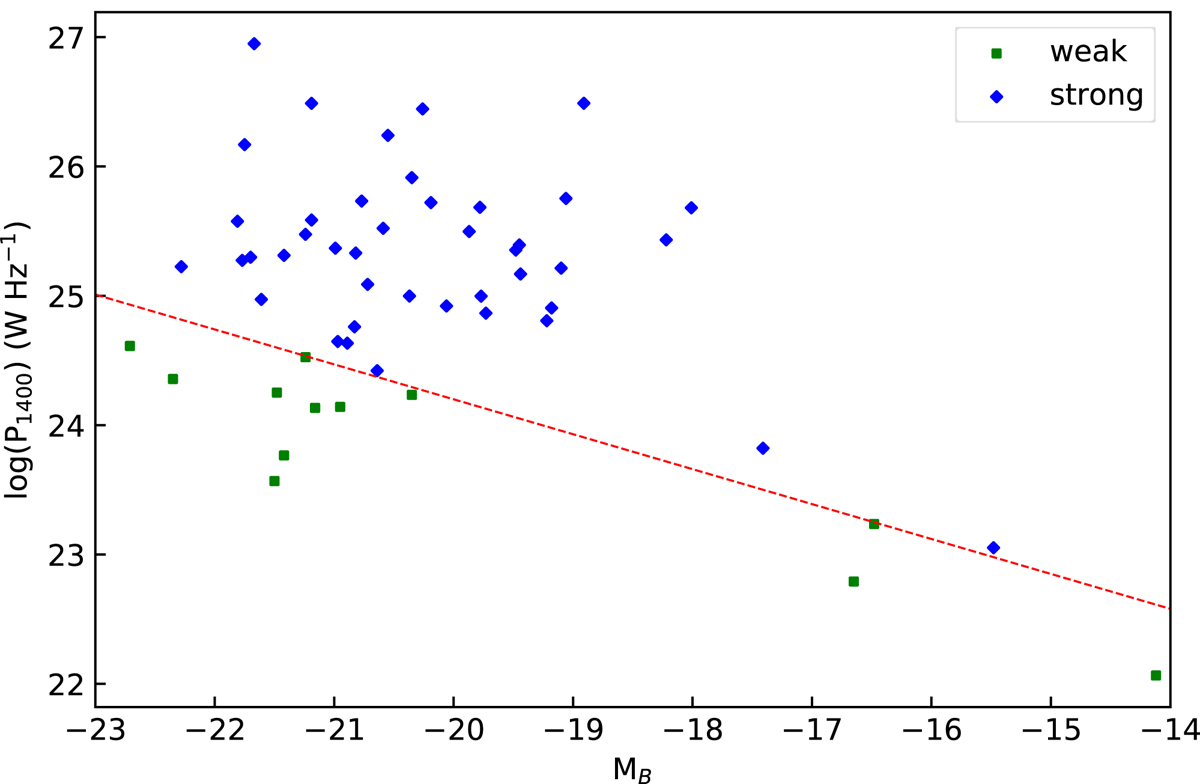
Absolute radio brightness calculated using the photometric redshifts over the B magnitude for the polarised AGN sources. Green symbols represent sources classified as weak AGN and blue ones sources classified as strong AGN. The dashed line is given by Eq. (1) and resembles the cutoff previously used to differentiate between the FR phenotypes.
Current usage metrics show cumulative count of Article Views (full-text article views including HTML views, PDF and ePub downloads, according to the available data) and Abstracts Views on Vision4Press platform.
Data correspond to usage on the plateform after 2015. The current usage metrics is available 48-96 hours after online publication and is updated daily on week days.
Initial download of the metrics may take a while.